OP5 Monitor is a network monitoring solution originally launched out of Sweden all the way back in 2004, with the goal of offering IT monitoring capable of handling larger environments without skipping a beat, but also being suitable and affordable for smaller instances as well.
Their goal is to put the control in the hands of the IT staff, making it easier for them to do their jobs more effectively, and making it easier to make actionable business decisions with real-world data.
OP5’s products can help IT teams to monitor everything, and also to easily visualize it in a way that paints a clear picture of operations, and we’ll be taking a look at some of the key features in just a moment.

Pricing
They have a 30 day free trial that you’re able to download to test out, and make sure it meets your needs.
It includes a full featured version of their software for an unlimited number of devices, and full access to their support team to help get everything going.
This ensures that you’re able to really take it for a proper test-drive and get the most out of it during that time. Once your 30 days is up, you can keep using it, but the number of devices is limited to 20, and you won’t have access to support.
Your price will depend on the number of devices, any addons you choose to include, which level of support you require, and which license type best suits your organization. In addition to that, there are numerous 3rd party plugins which are compatible.
Their pricing tiers are based on giving individual quotes depending on the needs of your organization, so that you aren’t overpaying for more than exactly what you require. You can reach out to them and they’ll put together a custom package and quote for you based on the specs of your network and what type of setup you’ll need.
They have an impressive list of clients that rely on them for network monitoring, including Scania, Tele2, and Comcast. Their customer satisfaction score is a staggering 98%, and they boast a 95% renewal rate.
They have three different types of licenses available, which are perpetual, pay as you go, and a subscription model. They offer on-site training which takes 1-2 days and is intended for a group learning environment. There is also an online training academy.
Features & Capabilities
There are a lot of key features to cover that make this open source monitoring solution shine. Let’s go over them now…
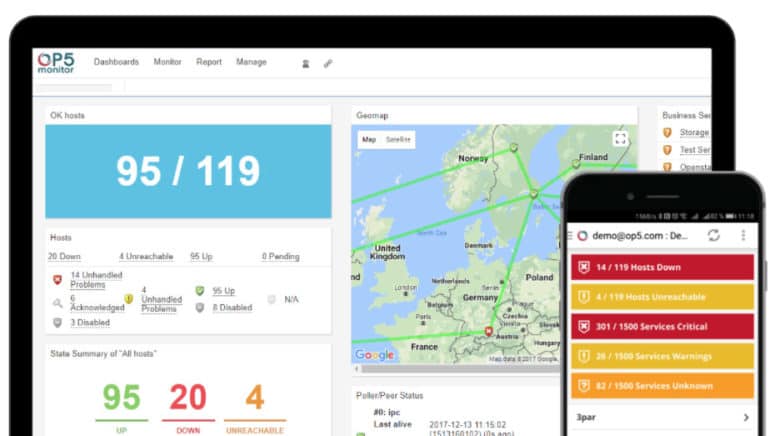
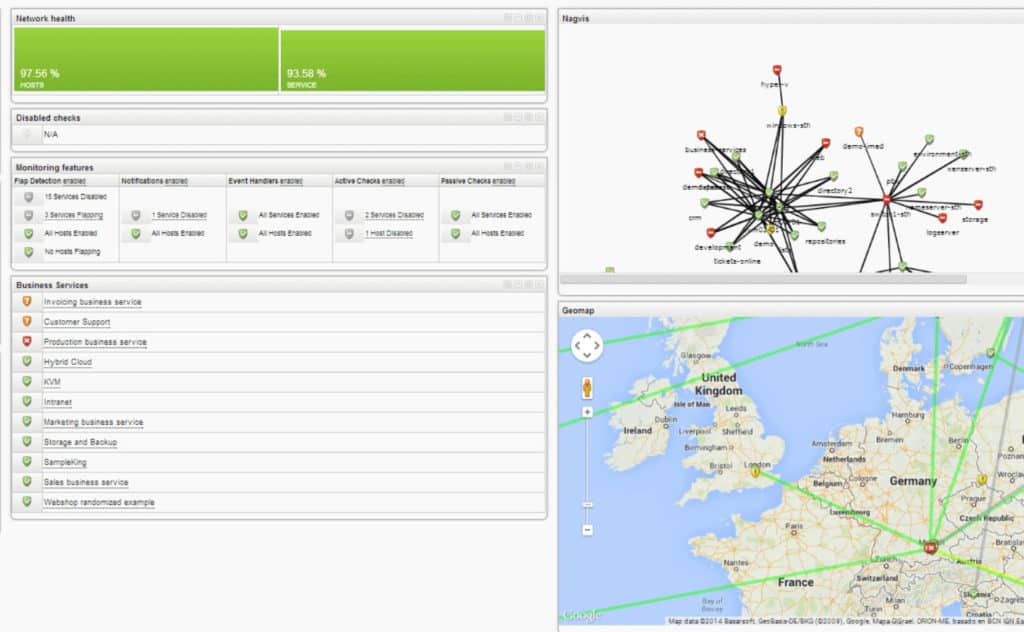
Dashboards: One of the things that really stands out immediately is the unified dashboard itself. You’re able to create custom dashboards to display whatever you want. There are widgets that you can choose from, and all you’ve got to do is drag and drop them in place, depending on which information is most crucial for you to see. Your dashboard can show you the performance of hundreds, or even thousands of devices across your whole network, to the exact people that need to see each piece of data.
Scalability: OP5 puts a strong emphasis on the ability to scale quickly and easily. You can integrate one configuration interface across multiple datacenters. It has built-in load balancing and redundancy, and it’s also easy to scale down when necessary.
Automation: You can integrate with a variety of 3rd parties, for example for CRM’s, or ticket systems. Smart monitoring has the power to heal itself on the fly, while reducing the likelihood of human-error, and using less resources.
Business Service Management: This helps to connect IT with business services. It is designed to empower organizations with information to make better decisions, based on data.
Reporting: The reporting system in OP5 is designed to give the right information to the right people, whenever they need it. The reports are highly customizable and ensure that various members of an organization can access the reports they need.
Notifications can be setup to trigger when a hard state change occurs, and when a host or when a service remains in a hard non-OK state for a set amount of time. You’re able to view the top alert producers which helps to see if any services are causing too many problems on the network. That’s just one example of many.
Migration: OP5 makes it very easy to migrate from Nagios, with the ability to keep using agents and plugins that are already in use.
OS Compatibility
OP5’s range of products can be deployed on versions of RedHat 6.x and CentOS 7.x, both in 64bit, if they haven’t reached their end-of-life yet.
The browsers that are supported are Firefox, Internet Explorer, and Google Chrome. For Firefox, you’ll need version 38+, for IE you’ll need 11+, and Chrome works for non-touch devices on PC or Mac.
In addition, it has been claimed that Opera 9.5 and versions of Safari after 3.1 have been reported to work as well, however they are not officially supported so you’re on your own if it isn’t working smoothly for whatever reason.
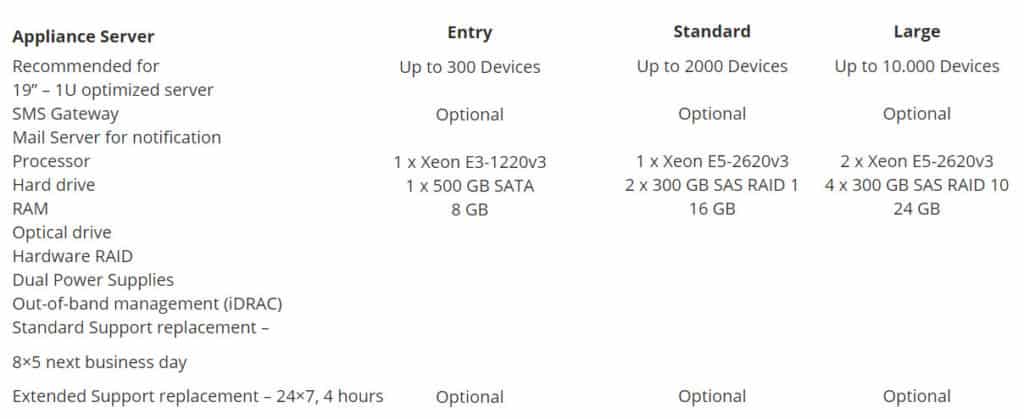
Deployment Recommendations
Support
They offer support plans in three different tiers. The Basic support tier allows for up to 6 incidents, however Standard and Premium support plans include unlimited incidents.
The larger plans allow for more named contacts on the account, and more ways to get in touch with their support team. Basic and Standard support are available during business hours from Monday to Friday, whereas the Premium tier is 24/7. Once again, like all of their pricing options, it comes down to meeting the needs of your network.
Getting Started
You can find links to download OP5 Monitor for environments based on Windows, Linux, Azure Cloud Server, and AWD. Click here to visit the downloads page to start your trial of OP5 Monitor.
If you’re interested in taking the DIY route, you can download their libraries directly from this page on this website.


