Nagios Log Server is an expansive log collection and parsing software that allows System and Network Administrators to pool logs from various systems in one centralized location. It allows for rapid queries and filtering, as well as reporting and real-time data presentation.
Pricing
There are 5 main pricing plans available for Nagios Log Server. They are as such:
- 500 mb/day: This plan is free, and has unlimited users, as well as unlimited retention.
- Single Instance: This plan costs $1,995, and allows for one installation which means failover is not an option. The data plan is no longer capped with Single Instance.
- 2-Instance: This plan costs $4,995, and allows for two separate installations. This will allow for redundant data by use of automatic fail-over. The two installations can perform load balancing and increase query speeds as well.
- 4-Instance: This plan costs $6,995, and allows for up to four separate installations. It includes all the options listed above, and further increased redundancy and speeds.
- 10-Instance: This plan costs $14,995, and allows for ten separate installations. This option has the maximum redundancy and query/indexing speeds of all the available plans.
Main Features
- Multi-Platform Log Collection:
Nagios Log Server is designed to receive logs generated from different operating systems and devices such as Windows, Linux, Mail Servers, Web Servers, Applications, SQL Servers and more. - Expandable Alert System:
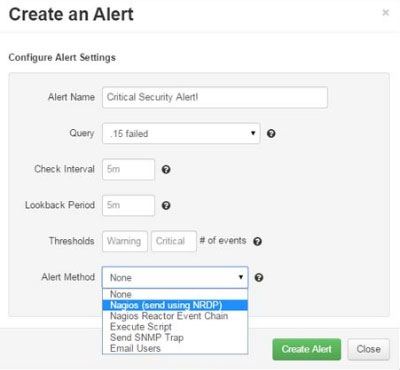
Users may configure thresholds based on log type, and then perform a few different tasks accordingly. There is an option to email users when an alert is triggered, send an SNMP Trap, execute custom scripts, or forward the alert on to other Nagios software. - Specific Queries / Filtering:
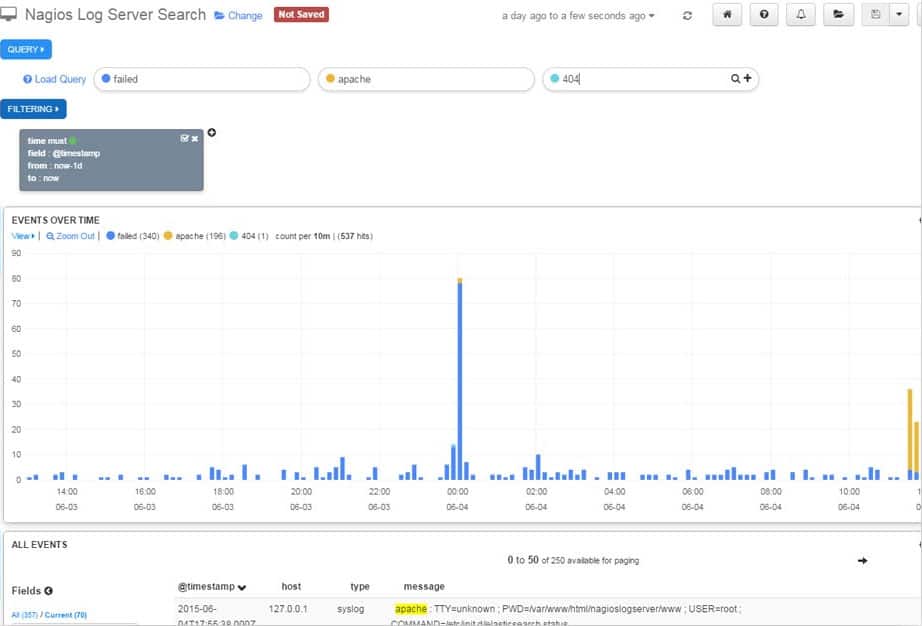
The default view is that of all logs over time, to give an overview of incoming events, but queries can also be input to search for specific log types. One can also filter using a large selection of options including timestamp, ID, host, message, severity, program, and more. There is also a logical NOT gate where you can exclude items that fit the selected criteria. - Live Reporting:
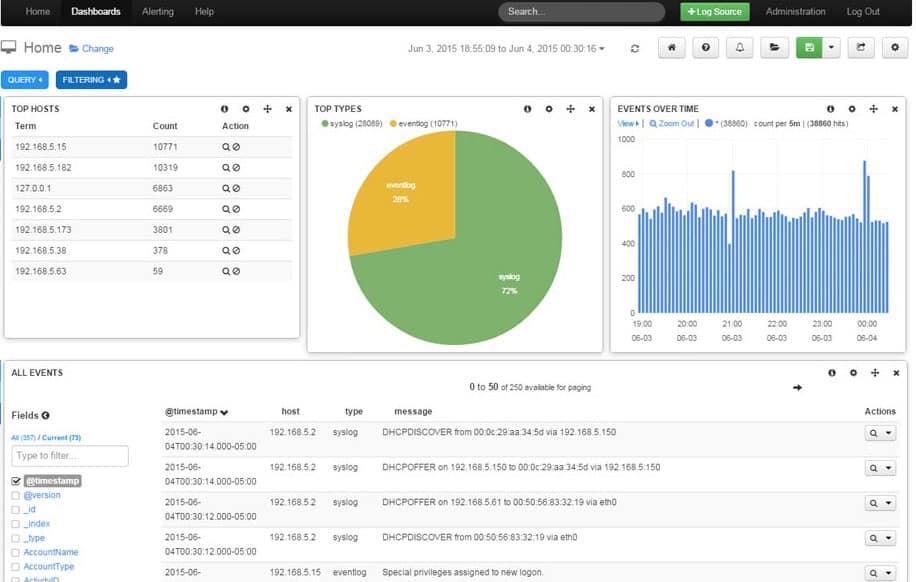
Nagios Log Server can generate a multitude of reports including pie charts, histograms, lists, and more. Report types are fully customizable using the above filtering options, and can be arranged to the user’s preference on a dashboard. These reports can be set to automatically update, creating a live status report. - Data Redundancy & Load-Balancing:
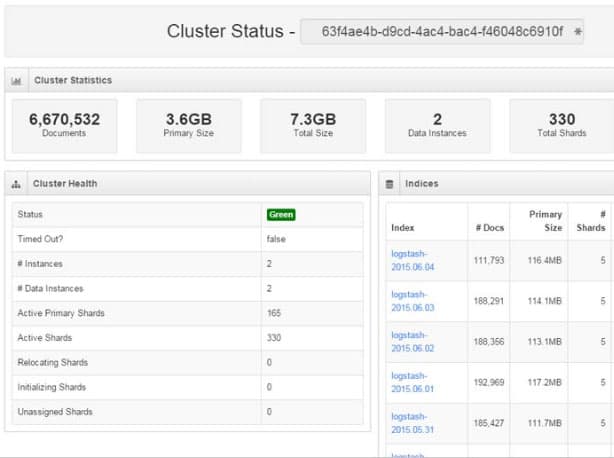
Selecting the 2-Instance or higher tier plan allows for a live failover configuration that automatically fails over in case one instance fails. Multiple server instances also allows for increased query and processing speeds due to load-balancing. - Open API:
Administrators can also make use of the software’s API, allowing for development of custom company-specific applications that integrate directly with Nagios Log Server.
Operating System Compatibility
Nagios Log Server can be installed manually on physical servers running either Red Hat Enterprise Linux, or CentOS. It is also available as a virtual machine for rapid setup and deployment using either VMWare 64 bit or 32 bit Virtual Machines.
Screenshots


Official Links
Nagios Log Server’s home page is located at:
https://www.nagios.com/products/nagios-log-server
It may be downloaded for VMWare 64 bit at:
https://www.nagios.com/downloads/nagios-log-server/
VMWare 32bit:
https://www.nagios.com/downloads/nagios-log-server/
And the manual (source) installation:
https://www.nagios.com/downloads/nagios-log-server/
Support, Technical Documentation, Tutorials and more can be found at:
https://library.nagios.com/library/products/nagios-log-server
Nagios Log Server is designed to be a central redundant repository for logging entries, with an open and expandable API and configurable reporting / alert features, it can serve as a useful tool to Network and System Administrator professionals.


