Splunk is a data analysis tool and while the base package is free to use, higher plans with extra features have been added on over the years. This expansion has paid off because while still making the Community Edition free to use, the company has grown to a value of $17.67 billion.
The Splunk system now includes options for the management of IoT devices and application development support. Above all the company has added on extensive security monitoring tools.
Here is our list of the best Splunk alternatives for log management:
- Graylog – EDITOR’S CHOICE This log management package is available for free to run on premises (Linux or Docker) or in two paid editions that provide system monitoring and security tracking from a cloud platform. Get a demo of Graylog Enterprise.
- ManageEngine applications Manager – FREE TRIAL The platform’s advanced analytics and AI-assisted smart alerts help IT teams quickly identify root causes and avoid alert storms, ensuring efficient and effective troubleshooting. Download a 30-day free trial.
- ManageEngine Log360 – FREE TRIAL An on-premises system that collects and manages log files to provide source data for security scanning. Runs on Windows Server. Start 30-day free trial.
- Datadog Log Management – FREE TRIAL This cloud-based service collects, consolidates and stores log messages from more than 170 applications, plus Syslog and Windows Events messages. Start a 14-day free trial.
- Site24x7 – FREE TRIAL Collects logs from applications, servers, and other devices across the IT infrastructure. It also allows users to search and query log data to identify specific events, errors, or patterns. Start a 30-day free trial.
- Sumo Logic A SaaS system that offers log management that includes an analysis system and archive management.
- LogZilla A high-speed log server for large volumes of log message throughput that is geared towards supporting SIEM systems. Runs on Docker containers.
- Mixpanel A market analysis tool that generates and stores interaction data with websites and mobile apps and then segments that data by different market dimensions. This is a cloud-based package.
- Fluentd A free, open source data collector that works with many log servers. This system is able to gather data from more than 500 applications. Runs on Windows, Linux, macOS, and Docker.
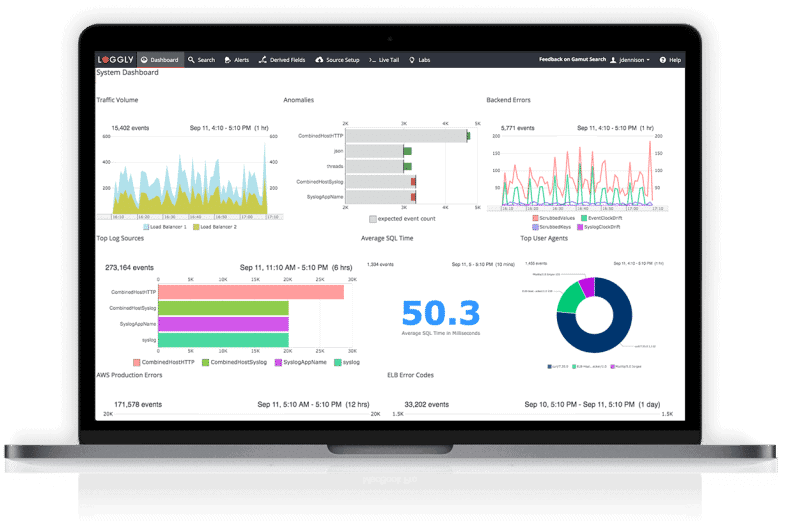
- Loggly A log ingestion service that is delivered from the cloud and can consolidate logs formatted in different formats.
- LogFaces This is a log server that consolidated, and stores log messages. The system also has a log viewer and a throughput tracking and recording service. Available for Windows, Linux, Unix, and Docker.
- Sentry This cross-platform code tracker creates an issues log for development projects and integrates with the major project management and bug tracking tools. Available in free vans paid versions.
- Syslog-ng This log collector works with the standard log message system for Unix, Linux, and macOS, which is called Syslog. Available in free and paid versions.
- ELK/Logstash The Elastic Stack is a suite of free log processing tools and Logstash is the log collector in the group.
Finding an alternative to Splunk greatly depends on what you want to use the system for. Fundamentally, the Splunk tool is most widely used for log file management. However, even in that category of task, there are a number of different uses that log file data can be put to.
Splunk is able to consolidate collections of log messages that are generated in different formats, which is a powerful aid to analysis. However, that function can be found in many tools – free and paid.
You can read more about each of these systems in the following sections.
The best Splunk Alternatives
1. Graylog – FREE TRIAL
Graylog is a log management package with a free on-premises version. Graylog Open is a flexible log collection tool that you can use to construct your own log analysis system. Splunk used to offer a free tool but that is no longer available. Like Splunk, Graylog provides added value packages. These are Graylog Enterprise, an observability package, and Graylog Security, a SIEM.
Key Features:
- Log collection: Receives, processes, and files log messages from many technologies
- Cloud-based packages: Include cloud space for log and metrics storage
- Observability package: Graylog Enterprise, on the cloud
- A SIEM option: Graylog Security, which includes Graylog Enterprise
- A free edition: Graylog Open, which runs on Linux or Docker
Why do we recommend it?
Graylog is a very similar package to Splunk. In fact, the Graylog team seems to be following the journey that Splunk forged for a free data processing tool through to add-value charged-for services. While Splunk eventually dropped its free edition, Graylog Open is still available.
Companies that just want a log manager would be more interested in Graylog Open than the charged-for add-on packages. Graylog Open is the code of Graylog – it’s where the tool started. This service is open source, so the code can be adjusted. However, there are plenty of opportunities to build new applications on top of Graylog Open without having to break into the source code.
Graylog Enterprise is suitable for companies that need a system observability package and don’t want to spend time developing their own on top of Graylog Open. The Graylog Security package is a SIEM. Both of these packages are hosted in the cloud and you can’t rewrite the code. Buyers of Graylog Security also get Graylog Enterprise. Both deals include cloud space for the storage of log messages and gathered statistics.
Who is it recommended for?
As explained above, there are three markets for Graylog: log management: observability, and security. The users of the free tool should be grateful that they can keep the code because if the Graylog team carry on with their emulation of the path of Splunk, they will eventually drop that free package.
Pros:
- A flexible free package: Graylog Open is open source
- Full-stack observability: Use data from logs for network, server, and application monitoring
- Extensive network monitoring: Tracks NetFlow as well as SNMP messages
- Reports on problem details: Alerts include detailed explanations
- Historical analysis: Opportunities for examining past events in both the Enterprise and Security modules
Cons:
- Not as extensive as Splunk: Splunk provides many more features, such as a SOAR for coordination with third-party tools
Access a demo of both the Enterprise and Security packages.
EDITOR'S CHOICE
Graylog is our top pick for a Splunk alternative because the Graylog team is following in the footsteps of Splunk. It will appeal to those businesses that feel that Splunk’s development has become too complicated. Those that miss the Free edition of Splunk will especially be drawn to Graylog Open. This gives you a log manager, if that’s all you need, but it also provides you an opportunity to construct your own tailored package, just as you used to be able to do with Splunk. Graylog doesn’t have as many pre-written features as Splunk. However, the company bundles in its observability package with its Security edition, which offers a much better deal than Splunk, where Splunk Observability Cloud and Splunk Enterprise Security are two separate purchases.
Download: Access a FREE Demo
Official Site: https://go2.graylog.org/see-demo-multi-dates
OS: Linux, Docker, or cloud
2. ManageEngine Applications Manager – FREE TRIAL
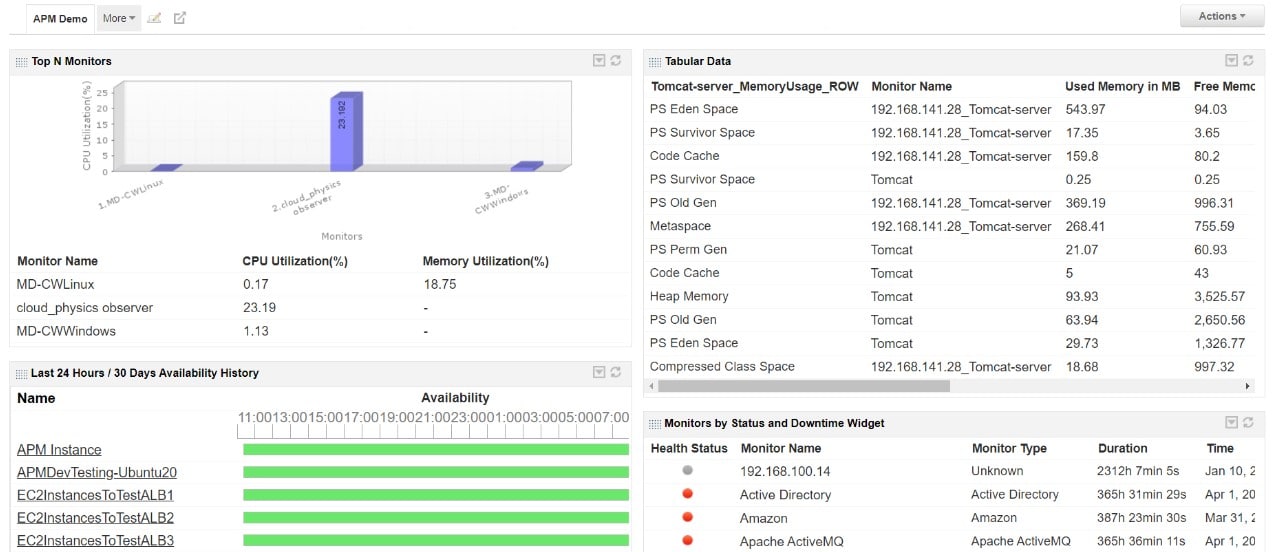
ManageEngine Applications Manager (APM) is a sturdy runner up in the race to provide an alternative to Splunk. This package is a stronger contender that Graylog in the field of application performance monitoring because it includes application dependency mapping and higher plans also provide distributed tracing and code profiling.
Key Features:
- Comprehensive Application Monitoring: Provides real-time monitoring of applications, servers, databases, and virtual environments to ensure optimal performance.
- End-User Experience Monitoring: Tracks the end-user experience with synthetic and real-user monitoring, helping to identify and resolve performance issues from the user’s perspective.
- Advanced Analytics and Reporting: Offers in-depth analytics and customizable reports to help IT teams make informed decisions and optimize application performance.
- Automated Root Cause Analysis: Utilizes AI and machine learning to automatically identify and diagnose the root causes of performance issues, reducing downtime and improving efficiency.
- Customizable Dashboards: Features intuitive and customizable dashboards that provide a centralized view of all monitored applications and their performance metrics.
- Seamless Integration: Integrates easily with other IT management tools and services, including cloud platforms, ensuring a comprehensive monitoring solution.
Why do we recommend it?
ManageEngine APM is recommended for its robust monitoring capabilities, advanced analytics, and user-friendly interface. These features help IT teams ensure optimal application performance and quickly resolve any issues that arise.
Its extensive support for a wide variety of applications, including Java, .NET, Node.js, Python, and more, makes it highly versatile. The tool’s integrated approach allows businesses to monitor everything from servers and databases to user experiences and cloud resources from a single console.
This unified view, combined with customizable dashboards and extensive reporting features, ensures that organizations can maintain optimal application performance and meet business goals.
ManageEngine Applications Manager stands out due to its comprehensive monitoring capabilities that cover applications, servers, databases, and virtual environments, providing real-time insights and advanced analytics. ManageEngine APM excels in tracking end-user experience, which helps IT teams identify and resolve performance issues from the user’s perspective, something that Splunk also offers but often at a higher cost.
Additionally, APM’s automated root cause analysis powered by AI and machine learning ensures quick identification and resolution of issues, minimizing downtime. Its seamless integration with other IT management tools and cloud platforms makes it a versatile choice for organizations looking for a cost-effective yet powerful alternative to Splunk.
Who is it recommended for?
ManageEngine APM is ideal for medium to large enterprises that need comprehensive application performance monitoring. It is especially beneficial for IT teams that manage complex application environments and require detailed insights and analytics to maintain performance.
Pros:
- Comprehensive Monitoring: Provides extensive monitoring capabilities for applications, servers, databases, and virtual environments.
- User Experience Tracking: Monitors end-user experience to ensure applications are performing well from the user’s perspective.
- Advanced Analytics: Offers detailed analytics and customizable reports to help optimize application performance.
- Root Cause Analysis: Uses AI and machine learning to quickly identify and diagnose performance issues.
- Customizable Dashboards: Features intuitive dashboards that can be tailored to specific monitoring needs.
- Seamless Integration: Integrates well with other IT management tools and cloud platforms.
Cons:
- Resource-Intensive: Can be resource-intensive, potentially impacting system performance on lower-end hardware.
Get started with a 30-day free trial.
3. ManageEngine Log360 – FREE TRIAL
Key Features
The features of Log360 include:
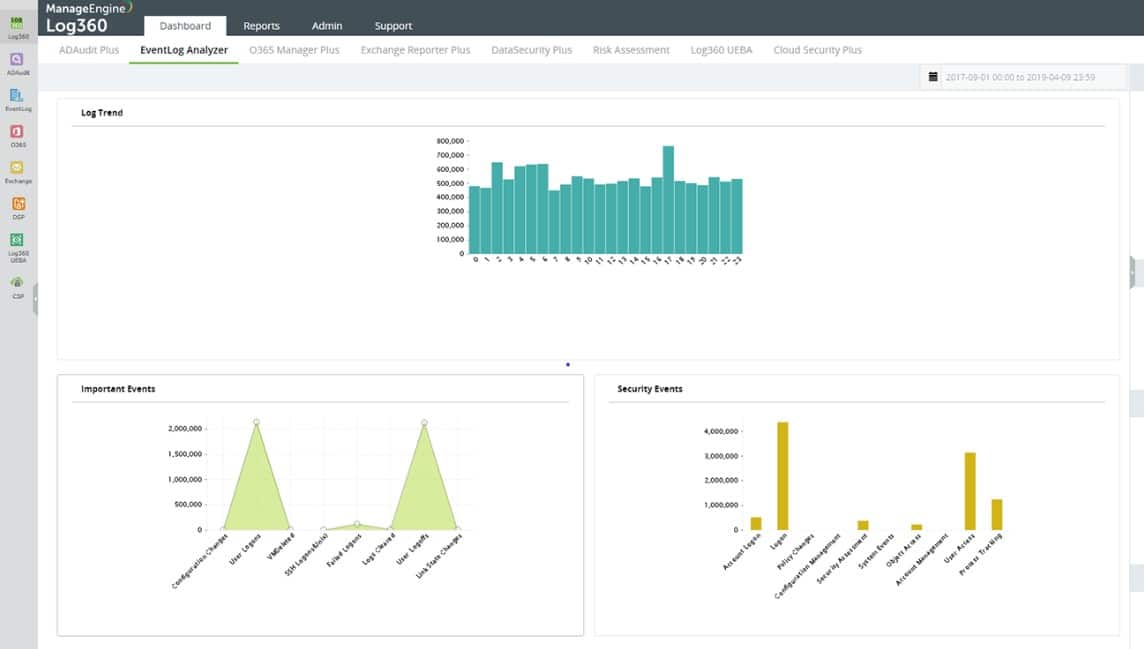
- Collects Windows Events and Syslog messages
- Interfaces with more than 700 software packages to extract event information
- Consolidates log records by converting them into a common format
- Stores log files in a meaningful directory structure for compliance auditing
- Compliance with GDPR, GLBA, PCI DSS, FISMA, HIPAA, and SOX
- Includes a data viewer for manual analysis
- Performs automated threat hunting as a SIEM
- Deploys user and entity behavior analytics for activity baselining
- Uses anomaly detection to identify threats
- Sends threat notifications through ManageEngine ServiceDesk Plus, Jira, and Kayoko
- File integrity monitoring
Why do we recommend it?
We recommend ManageEngine Log360 for its robust features, including automated threat hunting and compliance with multiple standards like HIPAA, SOX, and FISMA. Its capability to interface with over 700 software packages makes it extremely versatile and well-suited for complex environments.
Who is it recommended for?
ManageEngine Log360 is ideal for enterprises that have to meet various compliance standards and require a detailed, automated approach to security and log management. Its comprehensive features make it suitable for IT professionals engaged in compliance auditing, threat detection, and data analytics.
Pros:
- Supports using 700+ software programmes as an interface to extract event data
- Creates a standard format for all log records in order to consolidate them
- HIPAA, SOX, and FISMA compliance reporting is available
- Offers automated threat-hunting
- Alerts via ManageEngine ServiceDesk Plus, Jira, etc.
Cons:
- ManageEngine Log360 does not support Linux
ManageEngine Log360 has a complicated price structure with a number of paid add-ons. You need to visit the Get a Quote page at the ManageEngine website to discover the price for your implementation. There is a Free edition available that is limited to collecting data from 25 workstations.
The paid version is called the Premium edition and it is available for a 30-day free trial. The software package runs on Windows Server.
4. Datadog Log Management – FREE TRIAL
Datadog is a platform of IT system monitoring and management tools. The Datadog Log Management system offers tools to collect, process, analyze, and store log messages.
Key Features
- Datadog Log Management has the following features:
- The Log Management package provides data collection agents
- Consolidates different log message formats
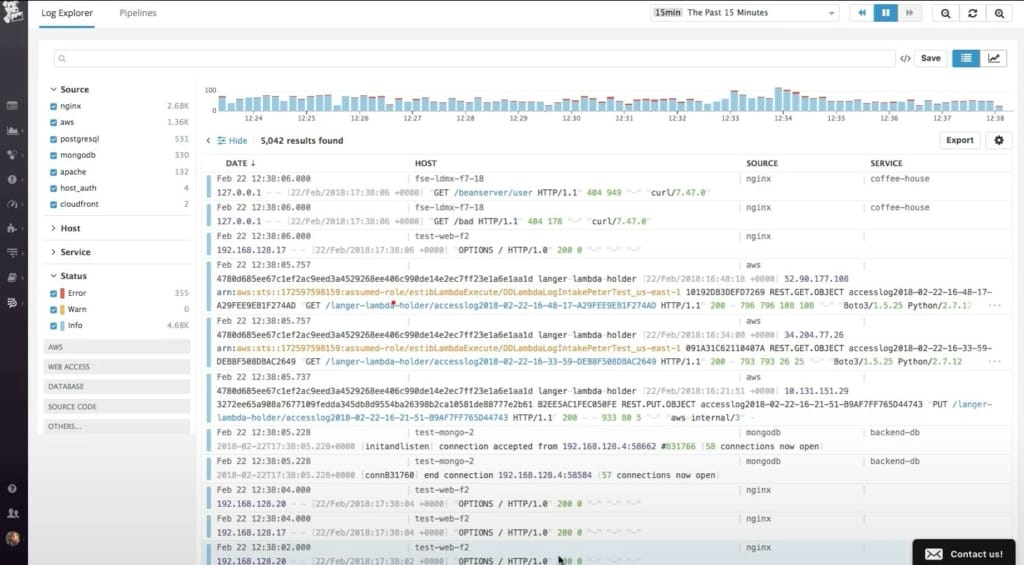
- Shows messages live in the console as they arrive at the log server
- Create a meaningful logfile directory structure and rotates log files
- Includes storage space for log files
- Provides a log analysis service
- Manages log archiving
Why do we recommend it?
We recommend Datadog Log Management for its comprehensive approach to log data, from collection to storage. The real-time display of messages and the ability to visualize log data with graphs and charts make it a powerful tool for any IT team.
Who is it recommended for?
Datadog Log Management is recommended for businesses looking for real-time insights into their system logs and those wanting a holistic solution that includes log storage and analysis. Its features are particularly beneficial for IT teams who require advanced filtering and graphical representation of log data.
Pros:
- Easy to collect, examine, and store log messages
- Displays messages received by the log server in real-time
- Offers proper storage space for log files
- Allows log filtering to discover security events
- Displays log data with graphs and charts for better analysis
Cons:
- Short testing and trial period
Pricing: Datadog Log Management is a metered service and there are two elements to price calculation.
Ingest is the log collection and processing service and costs $0.10 per GB of processed data per month if paid as a credit in advance.
Logs can be self-hosted or you can take out the Datadog log hosting and archiving service. This is called Retain or Rehydrate and it costs $1,70 per million log events per month with a 15-day retention period. For a 30-day retention period, the price increases to $2,50 per million log events per month. This is the price for the storage of live logs and you are expected to take out a separate subscription to a cloud storage platform to store archives.
You can access a 14-day free trial here: https://www.datadoghq.com/free-datadog-trial/
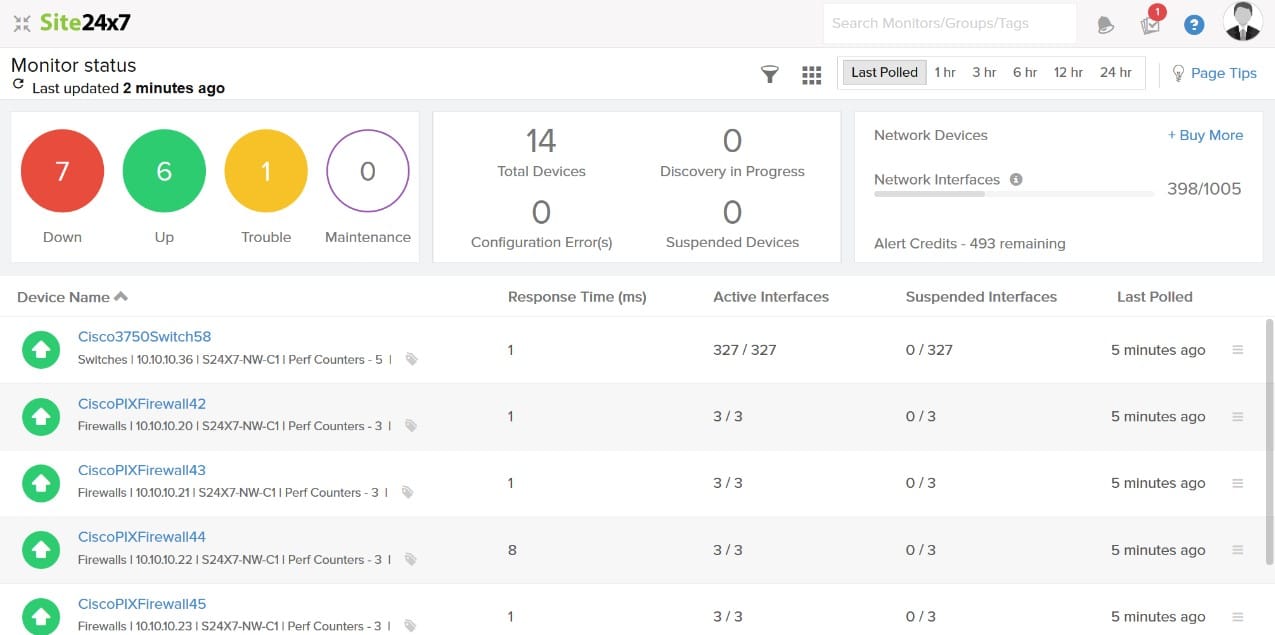
5. Site24x7 – FREE TRIAL
Site24x7 is one of the most popular log management and monitoring tools. Most organizations use this tool for collecting data from several sources, storing and running analysis to identify the security events that have the most significance. Apart from monitoring logs, the tool can also be used to watch over servers, applications, networks, and websites. It comes with various features and capabilities that make it stand out from the rest and the top choice for Splunk alternatives.
Key Features
- Centralized log management
- Unified observability
- Automated log discovery
- Search and filter option
- Faster troubleshooting
Why do we recommend it?
It is a cloud-based solution that helps perform centralized analysis for logs coming from various sources and index them for quick searches. Additionally, with the help of Site24x7, users can keep an eye on log issues and handle log data to get alerts right away.
The robust tool helps collect, filter, and analyze all the incoming logs and troubleshoot issues faster. It even has log collectors that simplify the whole process of collecting log data from different servers, applications, and cloud platforms. Additionally, custom integrations can be used to save your log patterns in the necessary formats.
Who is it recommended for?
IT teams and businesses of all sizes can use the tool and choose from the different editions as per their choice. All the editions offer similar features, but they differ in capacity. Small businesses can subscribe to any of its plans; however, large businesses might require to add more capacity for which they must pay an additional cost.
Pros:
- Users can correlate all log stats into a dashboard that they can customize
- Integrates well with external ITSM and third-party tools
- Automate processes to solve issues without the need for human intervention
Cons:
- Would prefer a longer trial period for testing
Start a 30-day free trial.
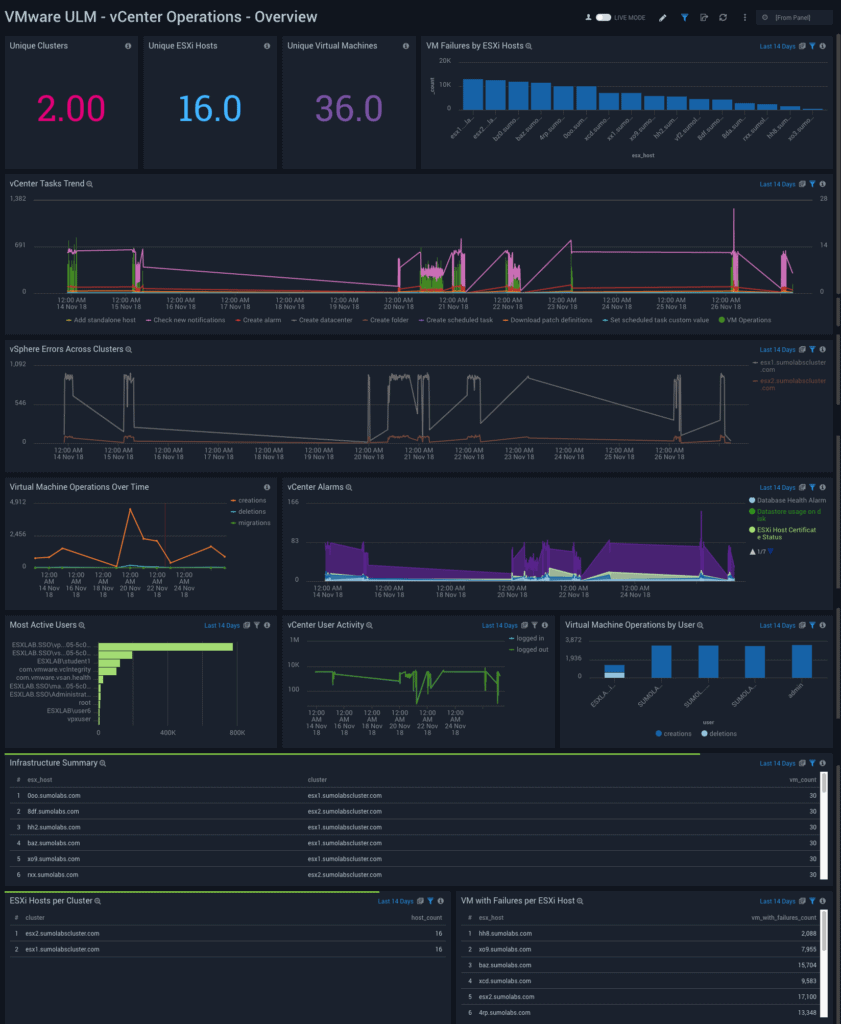
6. Sumo Logic
Sumo Logic is a cloud-native tool that provides log management and analytics services to make the most of big data generated by machines and to get useful insights from the same.
Key Features
The features of Sumo Logic are:
- It is a unified platform for all logs and metrics, so you can monitor and analyze all apps and infrastructure from a single location.
- Advanced analytics, including machine learning and predictive analytics, help to identify patterns and anomalies from your data.
- Provides a comprehensive understanding of your business environment.
- Comes with a multi-tenant architecture that scales on demand.
- Supports rapid growth and cloud migration.
- You can get started within minutes, thanks to its SaaS capabilities.
- Complies with many industry standards
Why do we recommend it?
We recommend Sumo Logic for its unified platform that allows tracking of all applications and infrastructure from a single location. Its advanced analytics and machine learning capabilities make it exceptional for spotting data patterns and anomalies.
Who is it recommended for?
Sumo Logic is best suited for enterprises undergoing rapid growth or cloud migration. It’s also ideal for organizations that require advanced analytics and want to adhere to multiple industry compliance standards. The SaaS capabilities make it easy for teams to get started quickly.
Pros:
- Tracks all applications from a single location
- Quickly discovers data patterns and anomalies using the advanced analytics
- Generates detailed insights into your company’s environment
- Sumo Logic meets a variety of industrial standards
- Hardly takes any time to get started
Cons:
- Users may find difficulty at the time integration or initial onboarding
- Some users may find difficulty in learning as it is quite challenging
Sumo Logic comes in three editions:
- Sumo Free – This is a free version that comes with a limited set of features
- Sumo Professional – $90/month per 1GB average daily ingest
- Sump Enterprise – $150 / month per 1GB average daily ingest
The paid versions come with a free 30-day trial period. You can download the free version as well as the trial software for paid versions here.
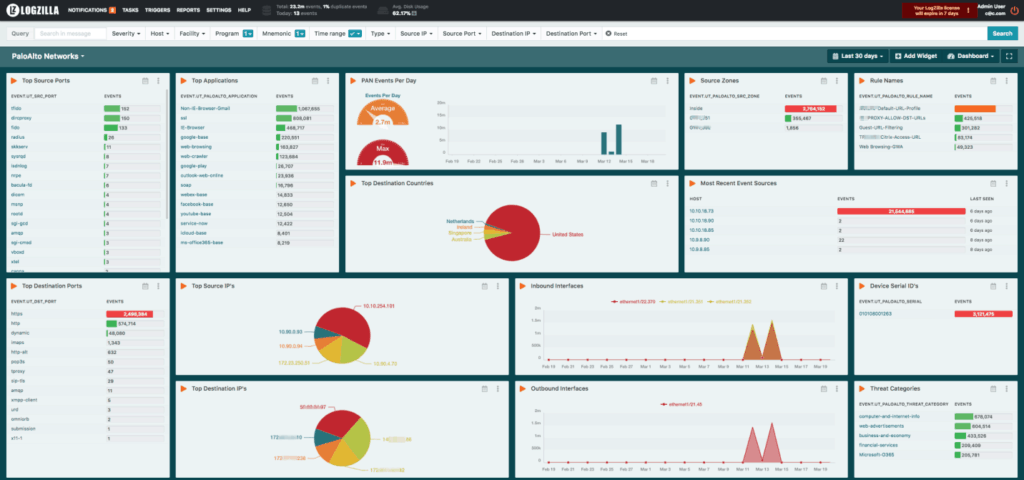
7. LogZilla
LogZilla is a Network Event Orchestrated (NEO) platform that provides real-time network insight for enterprise network teams.
Key Features
Here are some of the features of LogZilla.
- Helps IT teams to identify network challenges preemptively.
- It can record up to 855,000 events per second, and this amounts to nearly 40TB a day.
- Comes with many automation features for event enrichment, coordination and repair.
- Requires no prior training and you can get started within minutes.
- Reduces Total cost of ownership (TCO) by 50 to 90%
- Pre-processes data before forwarding it to Syslog and SNMP Trap receivers
- Eliminates false positives.
- Runs in docker containers, which means, you can run LogZilla on any operating system.
Why do we recommend it?
We recommend LogZilla for its exceptional real-time network insight and high-speed event tracking, capable of tracing up to 855,000 events per second. Its automation features for event enrichment and coordination further contribute to its robust capabilities.
Who is it recommended for?
LogZilla is ideal for enterprise network teams that need real-time insights to proactively identify and tackle network challenges. With its high throughput and focus on reducing the total cost of ownership, it’s particularly well-suited for large-scale operations.
Pros:
- Network teams can assess network insight in real-time
- Helps in the proactive identification of network problems by IT teams
- Results in 50–90% reduction in the total cost of ownership
- Offers automated features for event enrichment
- Helps trace 855,000 events per second
Cons:
- Need to send request for quotes
- Lack of customization options
According to prweb.com, the list price of a LogZilla license is $525 for small and medium businesses, and this includes support and email alerts as well. It is free to use in networks that generate less than 500 events in a day.
For custom pricing, contact the sales team. You can download the free version here.
8. Mixpanel
Mixpanel is a business analytics tool that tracks user interactions on web and mobile applications, and helps for targeted communication. It also measures user engagement and retention.
Key Features
The features of Mixpanel are:
- Discovers insights quickly
- Visualizes your data in different formats, so you can understand easily.
- Allows you to bookmark your reports, so you can access them at any time.
- Gives a detailed look into the behavior of customers on your app/website, so you can make the necessary improvements.
- Offers funnel analysis to help you understand where your customers drop off, so you can boost your conversion rates.
- Uncovers trends in your data automatically.
- Helps you to act intelligently on your findings. Allows you to automatically triggers messages, do A/B tests and personalize communication. You can even measure the results of these efforts on this platform.
- Lets you learn more about your end users.
Why do we recommend it?
We recommend Mixpanel for its comprehensive tracking of user interactions on web and mobile platforms, as well as its robust analytics features like funnel analysis and automatic trend discovery. The tool not only collects data but also enables actionable insights through features like A/B testing and personalized communication.
Who is it recommended for?
Mixpanel is well-suited for businesses and marketers who want to understand user behavior, engagement, and retention in a nuanced way. Its features make it ideal for those looking to optimize conversion funnels and act on data-driven insights to improve user experience.
Pros:
- Monitors user behaviour on websites and mobile apps
- Maintains a record of user retention and engagement metrics
- Supports report bookmarking
- Supports funnel analysis that helps in identifying client drop off
- Users can visualize collected data in a different format
Cons:
- More suitable for business networks
- Weak support system
Mixpanel comes in three versions :
- Free – 100,000 tracked users per month with a total of 1,000 recorded events per tracked user.
- Growth – 100,000 tracked users per month with a total of 1,000 recorded events per tracked user with analysis facilities. Price starts at $25 per month.
Enterprise – Advanced analytical features and an expansion of the number of tracked users and events, based on pricing. Contact the sales team for a quote. You can download the free version when you sign up at Mixpanel.
9. Fluentd
Fluentd is an open-source data collector that helps you to analyze and understand your data better. It is a cross-platform tool , and is a member of Cloud Native Computing Foundation (CNCF).
Key Features
Here is a look at some of the top features in Fluentd.
- Open source and all components are available under Apache 2 license.
- Ideal for distributed systems logging
- Decouples data sources from backend systems by creating a unified logging layer in the middle.
- Comes with more than 500 plugins that connect to many data sources and outputs.
- Setup process takes under ten minutes.
- Has a strong community
Why do we recommend it?
We recommend Fluentd for its versatility in handling distributed systems logging and the ease of setup. Its rich ecosystem of 500+ plugins allows seamless integration with a variety of data sources and outputs, making it highly adaptable.
Who is it recommended for?
Fluentd is ideal for organizations that manage complex, distributed systems and are looking for a unified logging solution. Its quick setup and open-source nature make it accessible for businesses of all sizes, from startups to enterprises.
Pros:
- Great solution for distributed systems logging
- Open-source tool with access to 500+ plugins
- Hardly takes 10 minutes for the configuration
- Fluentd a robust community for discussions
- Users can access several components under the Apache 2 license
Cons:
- Not an ideal solution for enterprises
- Less data visualization features are available
Download Fluentd for free.
10. Loggly
Loggly from SolarWinds is a popular cloud-based log monitoring and analysis software. It makes log data more useful and accessible to different groups within an organization.
Key Features
Loggly comes with the following features.
- Comes with proactive monitoring of key metrics and resources to eliminate problems before it affects end-users.
- Helps to trace the root cause of issues with an in-depth analysis of existing logs.
- You can get deep insights into the working and interaction of your components including their correlations.
- Integrates well with Slack, HipChat, GitHub, Jira and more.
- Analyses data, tracks SLA compliance and looks for specific data trends.
- Gives a visual representation of analyzed data for better understanding.
Why do we recommend it?
We recommend Loggly for its comprehensive capabilities in log monitoring and analysis. Its proactive monitoring and root cause analysis make it one of the best tools for averting issues before they affect end-users, and its seamless integrations with platforms like Slack and Jira add to its operational efficiency.
Who is it recommended for?
Loggly is ideal for organizations that require robust log analysis capabilities across multiple departments. Its feature-rich environment suits both tech-savvy professionals for in-depth analysis and those in managerial roles for oversight, making it versatile for various business needs.
Pros:
- Users from different groups can easily access and use log data
- Keeps track of key metrics and resources
- Helps track SLA compliance
- Generates deep insights
- Supports integration with Jira, Slack, GitHub, etc
Cons:
- A 30-day trial extension would be better
Loggly comes in four versions to suit your varying needs. They are:
- Lite: This is a free version that provides a basic log search for beginners.
- Standard – Starts at $79 a month, and is ideal for small businesses that want easy-to-use log analysis and monitoring.
- Pro – Starts at $199 a month and is designed for companies with a growing list of applications.
- Enterprise – Starts at $349 a month and is an all-inclusive analysis and collaboration option for enterprises.
The image below gives you a bird’s eye view of the features that comes with each version. You can download the free version or the 30-day free trial.
11. LogFaces
LogFaces is an enterprise logging suite that aggregates, stores, analyzes and displays logs in real-time.
Key Features
The features of LogFaces are:
- Comes with an out-of-the-box log server that stores all the log data. You own the log server and the aggregated data.
- No subscription fees and usage limitations for valid license holders.
- Sends notifications in real-time, so you don’t have to manage log files.
- The native log viewer is highly responsive and user-friendly.
- Analyzes your log data and helps to identify problems quickly.
- Data access is managed with your own LDAP directory.
Why do we recommend it?
We recommend LogFaces for its real-time log monitoring and the absence of subscription fees for valid license holders. Its user-friendly native log viewer and real-time notifications make it an efficient choice for managing logs.
Who is it recommended for?
LogFaces is best suited for enterprise settings where full control over log data is a priority. Its compatibility with LDAP directories and the absence of recurring fees make it an excellent choice for larger organizations that require robust and cost-effective log management.
Pros:
- Displays logs in real-time
- No monthly charges or usage restrictions for valid license holders
- Sends real-time notifications
- User-friendly log viewer
- Quickly discovers problems found in log data
Cons:
- Using a dashboard in large networks can make it feel crowded
- Compatibility issues with existing systems
There are two editions – Enterprise and Site. The Enterprise edition costs $699 while the Site edition costs $1599. Download a 20-day free trial here.
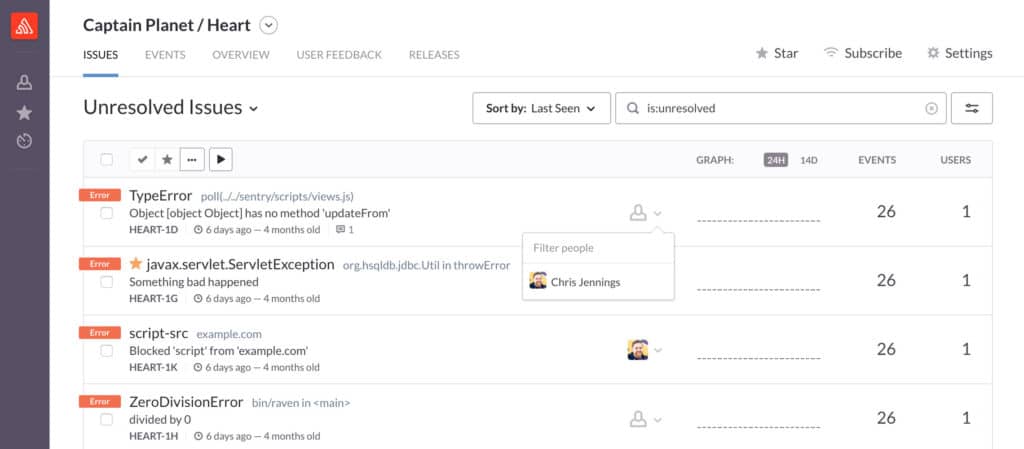
12. Sentry
Sentry is an open-source error tracking software that helps to monitor and fix crashes in real-time. It iterates continuously to check for errors, and in the process, boost the efficiency of employees.
Key Features
The features of Sentry are:
- Can be set up quickly with just a few lines of code.
- Sends notifications about errors through email, SMS or chat, depending on the existing workflow.
- Quickly finds and fixes errors with high efficiency and visibility.
- Its exception handling features makes it easy for developers to build better apps
- Allows you to integrate error tracking with every commit and deploy workflow.
- It is delivered as a host service.
- Works well with most programming languages.
- Errors monitoring includes bug’s history of events and actions to help you reproduce errors without waiting for user feedback.
- Gives error context with the right tags and other relevant information.
Why do we recommend it?
We recommend Sentry for its robust real-time error-tracking capabilities and its wide-ranging language support. Its notification features and exception-handling tools make it a top choice for efficient error management.
Who is it recommended for?
Sentry is ideal for development teams that require continuous and real-time error monitoring. It suits both startups and large enterprises, particularly those that use a mix of programming languages and seek seamless integration with their existing workflow for error tracking.
Pros:
- Monitors and remediates issues in real-time
- Constantly checks errors
- Quick to setup and supports most programming languages
- Notifies about errors vis SMS, chat, or email
- The exception-handling capabilities make it simple for developers to develop better applications
Cons:
- Does not support multiple logical groupings
- Alert copying is not available
The developer version is free, and it is ideal for personal projects and early stage applications. The Team edition starts at $26 a month, and is a good choice for apps and teams that expect to see a big growth in the coming months. Business edition starts at $80 a month while the Enterprise edition helps to support business critical applications. Contact the sales team for the price of Enterprise edition. Download the free edition here, and the trial versions of team edition here and business edition here respectively.
13. Syslog-ng
Syslog-ng is an open source implementation of the syslog protocol for Unix systems. It extends the original syslogd model and adds more features to make it more usable.
Key Features
The features of syslog-ng are:
- Can be extended with plugins to suit any use case.
- The additional modules can be written using C, Java, Python, Lua or Perl.
- Supports legacy BSD syslog (RFC3164), enhanced RFC5424, journald and JSON formats.
- Collects data from a diverse range of sources and correlates them to a common format.
- Comes with built-in parsers for unstructured data.
- Supports message queues such as STOMP and AMQP.
Why do we recommend it?
We recommend Syslog-ng for its highly customizable nature and support for multiple data formats including JSON. Its plugin architecture and support for various programming languages make it a versatile choice for handling logs.
Who is it recommended for?
Syslog-ng is recommended for organizations that require a flexible and extensible logging solution. It’s especially suitable for businesses that operate in heterogeneous environments with a mix of Unix systems, and that need to correlate logs from diverse sources into a unified format.
Pros:
- Plugins help extend functionalities
- Allows writing extra modules using Python, Java, or Perl
- Supports JSON formats
- Collects and correlates data into a common format
- Uses built-in parsers for unstructured data
Cons:
- Weak security as it does not support the authentication mechanism
- Relies on UDP transport, as a result, messages could be lost
There are two editions – open source and Premium. The open source edition is free while the Premium edition is paid. Contact syslog-ng for pricing. Download the open-source version from GitHub and click here for a trial version of the Premium edition.
14. ELK/Logstash
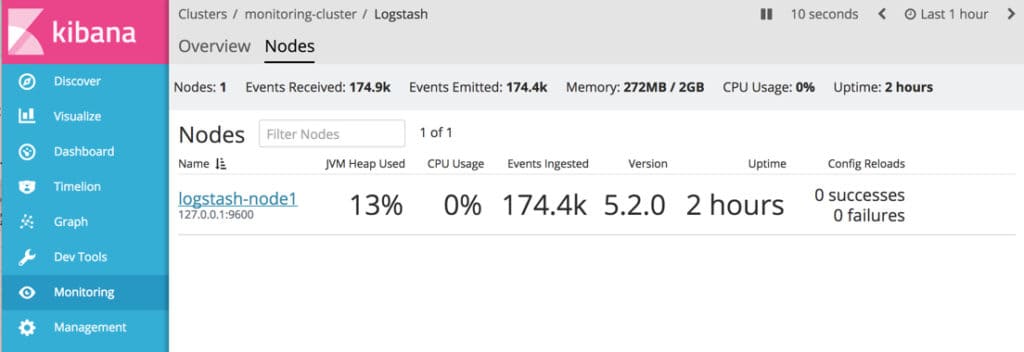
Logstash is an open-source tool that ingests data from many sources, analyzes and sends it to your preferred stash.
Key Features
Logstash comes with the following features.
- Supports a variety of input sources such as log files, web sites, applications, data stores, AWS services and more.
- Filters each event, identifies named fields to build structures and changes them to a common format for easy understanding.
- Deciphers geo coordinates from IP addresses.
- Excludes sensitive data fields.
- Comes with a huge library of filters to suit every organization.
- Supports many output streams, so you can send the data to the most effective platforms/devices.
- Integrates well with popular data sources like Netflow.
- Offers more than 200 plugins.
- Durable and secure.
- Allows to manage everything from a single user interface.
Why do we recommend it?
We recommend ELK/Logstash for its versatility in handling a broad range of data sources and its extensive library of filters. The tool’s capability to transform and structure data into a common format makes it extremely useful for complex data analytics.
Who is it recommended for?
ELK/Logstash is recommended for businesses that need to ingest and analyze large volumes of data from multiple sources. It’s ideal for organizations that require real-time analytics, geo-coordinate decoding, and data filtering, especially those in industries like e-commerce, finance, or health care.
Pros:
- Uses different filters for every event
- Supports integration with data sources such as Netflow
- Provides access to 200 plugins
- Uses IP addresses to decode geo coordinates
- Enables management of all operations with a single-user interface
Cons:
- Complex Management Requirements
- Uptime Issues are found
Download Logstash for free.
Conclusion
To conclude, Splunk is a great tool for data analytics. But that’s not the only one available in the market today, especially if you don’t want to spend so much money or if you want any specific features that’s not available in Splunk. We hope the above Alternatives to Splunk will help you make an informed choice when it comes to data collection and analytics.

