Solarwinds’ Response Time Viewer for Wireshark is a standalone tool that analyzes the packets captured by Wireshark, so you can get in-depth information about your network in a dedicated viewer.
This tool is a great one for troubleshooting network problems as you can analyze most common packet formats.
Typically, you should use Wireshark for capturing network traffic, and export the .pCAPng files to Response Time Viewer for a more detailed analysis.
From this analysis, you can glean a ton of information about your network, the applications that have the fastest or the slowest response time, and many other important information that can give you complete control over your network, applications and their performance.
Getting Started
Before downloading Response Time Viewer, make sure you have Wireshark installed in your system. You can download Wireshark from http://www.wireshark.org/download.html, and follow the installation wizard and instructions.
With that in place, download Solarwinds Response Time Viewer from:
https://www.solarwinds.com/free-tools/response-time-viewer-for-wireshark/registration.
Again follow the instructions for installation. It is a fairly straightforward and simple process.
Next, use Wireshark to capture the network packets, and export it to a location that can be accessed by Response Time Viewer.
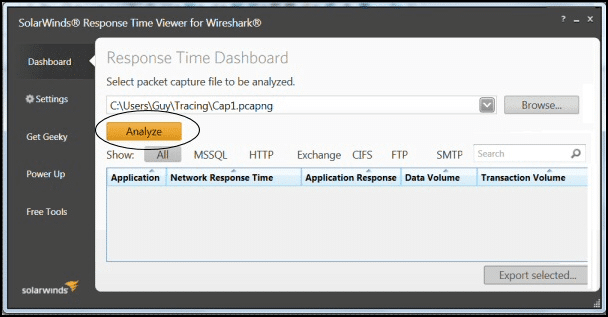
Open Response Time Viewer and use the “Browse” button to open the captured .pCAPng file.
Finally, click the “Analyze” button to start the detailed analysis.

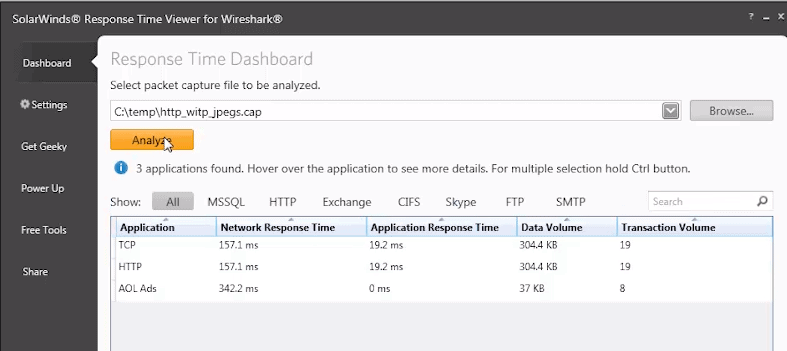
In the window pane below, you’ll get a detailed analysis of each application.
In this example, TCP, HTTP and AOL Ads are the three applications and they are analyzed across a range of different parameters such as network response time, application response time, data volume and transaction volumes.
From this information, it is easy to know which applications consume high levels of your network and bandwidth, and those that have maximum transaction volumes.
You can use this information for historical comparisons and to fine-tune your network or applications that consume the most resources. It also helps with capacity planning.
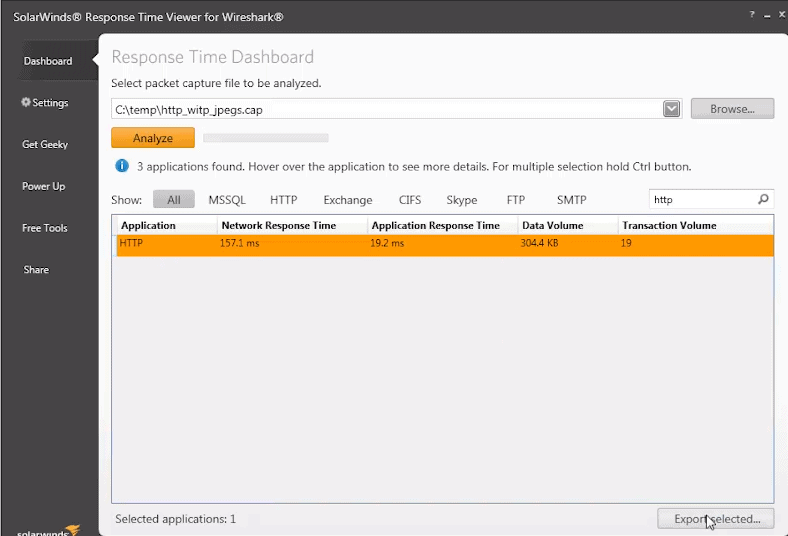
Once you’re done, you can export it back to Wireshark with a pre-configured filter.
All that you have to do is select the application, and click a button called “Export selected” located at the bottom right hand corner.
Analyzing your network and identifying performance issues doesn’t get easier than this.
Features
Response Time Viewer for Wireshark comes with a ton of features such as:
- Analyzes common packet capture formats
- Detects approximately 1200 applications
- Parses application data
- Calculates application and network response time
- Displays data and transaction volumes.
- Comes with filters for common applications
- Has a handy search feature to get to the application you want.
- Works well for Networks and Enterprises of all sizes.
Cost
This tool is 100% free to use.
Review
Response Time Viewer for Wireshark is a great choice for troubleshooting network connections and latency problems.
The data captured from Wireshark is analyzed quickly and is segregated into four parameters, namely:
- Network Response Time
- Application Response Time
- Data Volumes
- Transaction Volumes
One of the highlights is its intuitive and user friendly interface. Navigation is easy and you can pretty much find whatever you want.
In addition, it analyzes packets captured from Wireshark within a short time, so you do not have to wait endlessly to see the information you want.
Overall, the many salient features that come as a part of this tool make it an invaluable addition to every network administrator’s arsenal.


