This article will be comparing two SNMP monitoring tools: Paessler PRTG Network Monitor and Nagios XI. The current version of Nagios XI at the time this was written at is 5.4.11, and PRTG’s version is 17.4.36.3670.
Paessler PRTG Network Monitor – FREE TRIAL
Paessler PRTG is a powerful and easy to use network monitoring tool capable of a wide variety of functions from network mapping to help-desk ticketing. It is fully scalable and can be used by small businesses as well as multi-site corporations with ease. Running as an application on Windows, it provides an easy/quick install and a thorough tutorial on first launch.
Why do we recommend it?
PRTG Network Monitor by Paessler stands out with its extensive feature set, seamless scalability, and user-friendly interface. It offers robust monitoring capabilities, including support for a wide array of protocols, database types, QoS monitoring, and a unique helpdesk ticketing system. With its easy installation process on Windows and comprehensive tutorials, PRTG provides businesses with actionable insights quickly and efficiently.
Who is it recommended for?
Paessler PRTG Network Monitor is ideal for businesses, irrespective of size, that value an all-in-one monitoring solution with an easy setup, especially for organizations operating primarily in a Windows environment, seeking real-time insights, versatile reporting, and a tool that evolves with their scaling needs.
Unique feature
PRTG boasts unique features like monitoring QoS for VoIP and Cisco CBQoS, which Nagios XI lacks. Its proprietary helpdesk ticketing system, broader database monitoring capabilities, and direct support for sensors such as Netflow, IPFIX, sFlow, and jFlow give it an edge in areas where Nagios XI does not offer native solutions.
Nagios XI
Nagios XI is also a network monitoring tool, and requires a little more setup than Paessler PRTG does. Nagios supports network mapping, but does not have a help-desk ticketing feature. It is relatively low on resources, since it runs on either CentOS or Red Hat Enterprise Linux, and appears to be scalable.
The install is only simple to someone comfortable in a Unix/Linux command line environment, since you need to either install via command line or download and mount a virtual hard drive in VMWare, VirtualBox, or Hyper-V. If you choose the latter, you will need to configure network settings using the command line, and then you can log into the server from a client web browser on a separate box on your network.
Why do we recommend it?
Nagios XI offers efficient resource consumption, robust network mapping capabilities, and scalability that meets various enterprise needs. While it might require a more hands-on approach for setup, especially in a Unix/Linux environment, its custom mapping and auto-generated diagram features offer a granular view of network health and dependencies.
Who is it recommended for?
Nagios XI is best suited for organizations already entrenched in or comfortable navigating a Unix/Linux environment. Those who require a detailed, hands-on approach to network monitoring and prioritize customizability and low-resource consumption will find Nagios XI valuable.
Unique feature
Nagios XI distinguishes itself with a low-resource footprint, operating efficiently on CentOS or Red Hat Enterprise Linux, and offering advanced custom mapping and auto-generated network diagram features. Its setup, though demanding a deeper understanding of the Unix/Linux environment, provides users with a granular and hands-on approach to network monitoring, emphasizing customization.
Related Post: SolarWinds vs Nagios
Paessler PRTG vs Nagios Features & Differences:
- Automatic Network Scanning: Nagios and PRTG both support this to a point. PRTG will automatically scan the network, whereas you will need to manually specify ranges for Nagios to scan.
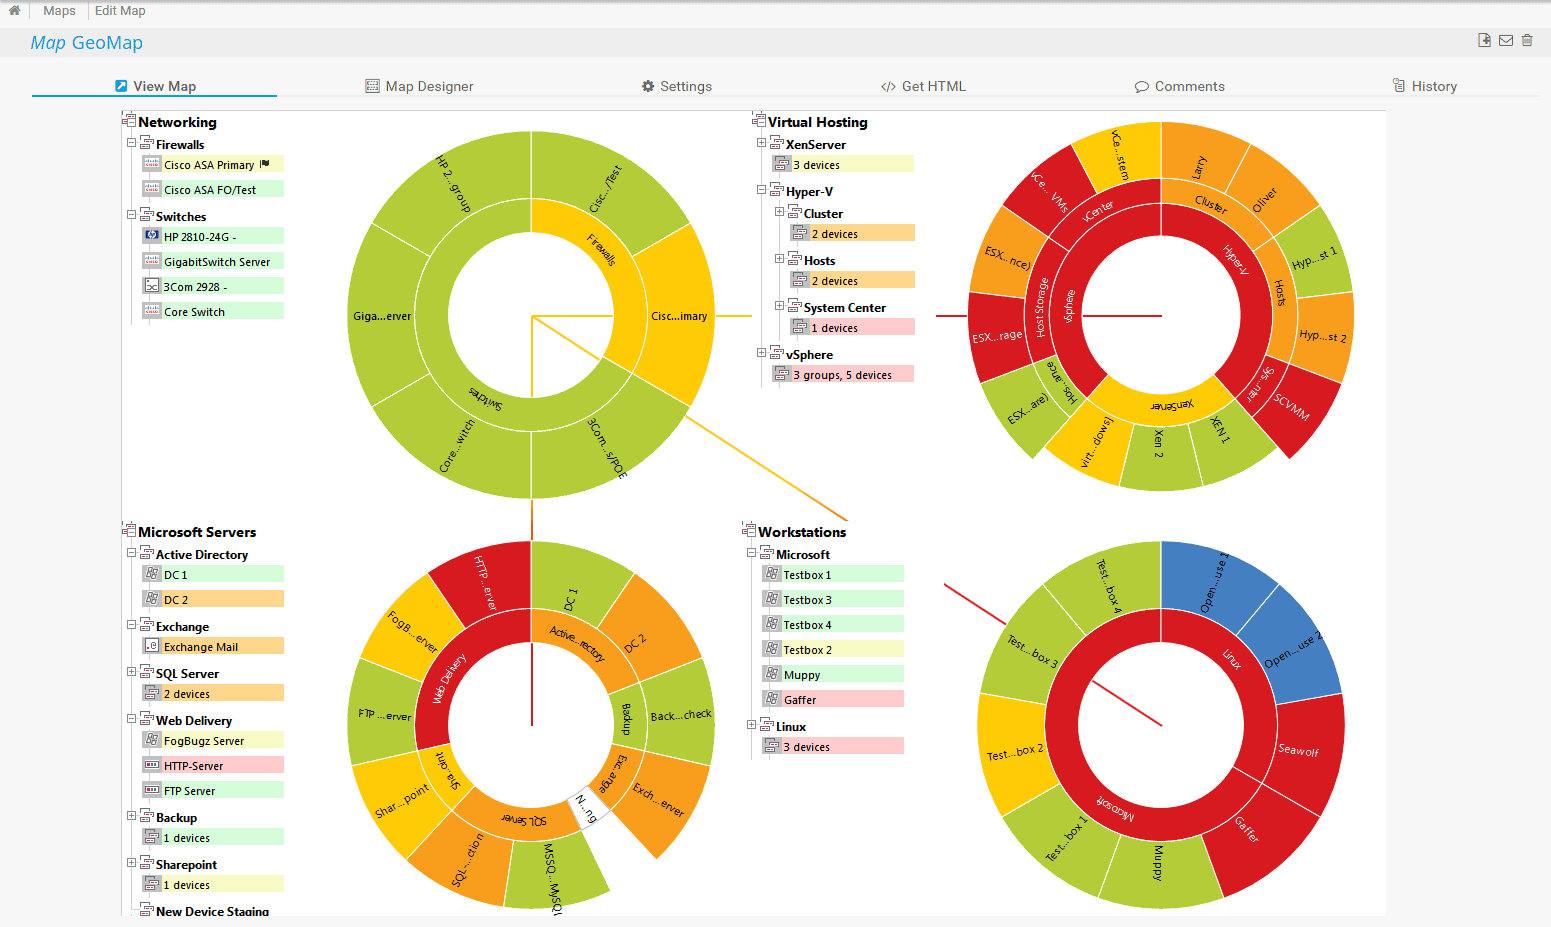
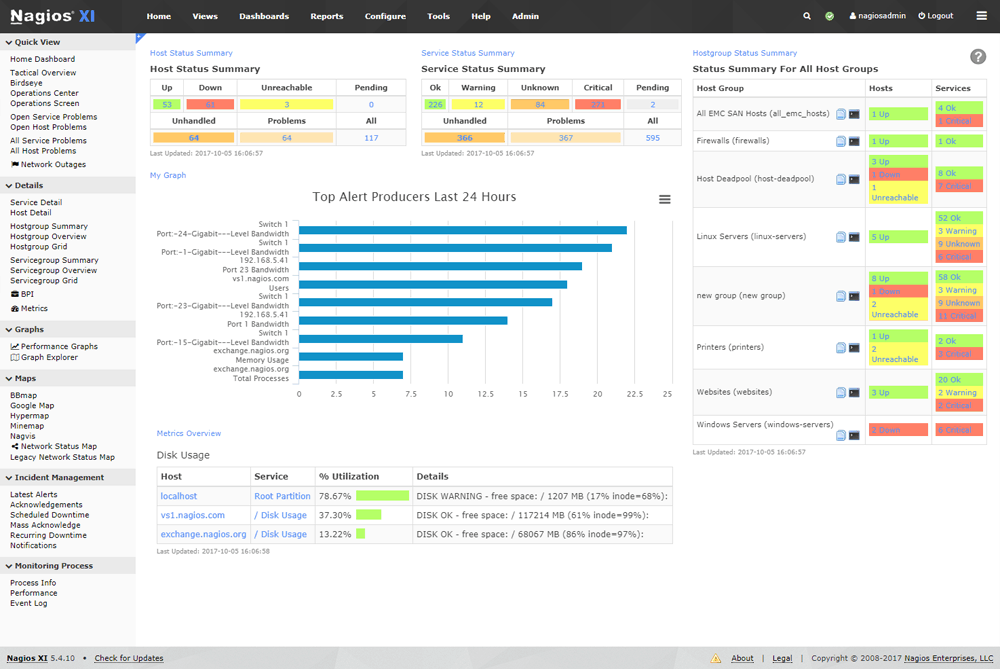
- Mapping / Topology: Both Nagios and PRTG support custom mapping and network diagrams. Nagios actually has an auto generated diagram feature, which you can see in the screenshot below.PRTG, however, claims that network maps are best created manually due to the spacing and cluttering of many devices.
- Monitoring via SNMP, WMI, ICMP, etc.: PRTG supports all of these. In addition, PRTG also supports SSH, packet sniffing, powershell, push message receivers, PRTG cloud monitoring, and others. Nagios supports SNMP, WMI, ICMP, and SSH, but does not support the others that Nagios can.
- Database Monitoring: PRTG supports SQL, MySQL, PostgreSQL, MongoDB, REST, and more. Nagios supports only SQL, MySQL, PostgreSQL, and MongoDB.
- QoS / SLA: PRTG is capable of monitoring QoS for VoIP, Cisco CBQoS, and more. Nagios does not. PRTG also has a full helpdesk ticketing program which can generate and assign tickets. Nagios does not have any form of ticketing program, and it’s SLA capabilities are strictly based on meeting node uptime thresholds.
- Computer/Server Hardware Health: PRTG offers monitors for hard drive health, printers, blade servers, virtual arrays, cisco devices, temperature and voltage, and more. I could not find any temperature or voltage sensors in Nagios. They may most likely be added through custom plugins you can download, but it appears as if they are not present in the factory installation.
- Internal Resource Monitoring: PRTG is capable of keeping track of CPU usage, memory usage, disk usage, network cards, bandwidth/traffic, speed/performance, availability/uptime, service information, and event logs. In comparison, Nagios can monitor CPU usage, memory usage, disk usage, and specific services / processes. Nagios cannot monitor bandwidth or speed like PRTG can, and instead offers a simple uptime counter for the network monitoring option of nodes.
- Web Server Monitoring: PRTG supports IIS and Apache, and is capable of scanning on http, https, ftp, and more. It is not capable of monitoring NGINX. Nagios is capable of monitoring a web site specifically, but I could not find the capability of monitoring IIS, Apache, NGINX, or any form of web server itself. Nagios’ web site scanning can use http, https, ftp, and more.
- Active Directory Monitoring: LDAP services and AD replication errors are supported by PRTG, which is actually quite useful. The program also integrates using LDAP if you wish, to better handle logons than custom accounts. Nagios also supports LDAP monitoring, and replication errors are possible to monitor using event traces, but there is no easy built-in option to pull them. Nagios will authenticate with LDAP if you use a custom plugin and go through the process of setting that up.
- Netflow, IPFIX, sFlow, jFlow Monitoring: PRTG supports all of these, including both version 5 and 9 of Netflow. Nagios appears to not support any of these sensor types.
- VM HyperVisor Monitoring: PRTG supports VMWare, Hyper-V, and Citrix XenServer. In contrast, Nagios can only monitor VMWare.
- Application Monitoring Features: PRTG has a number of built-in monitoring types for applications such as Dropbox and others, and also has the ability to run scripts / .exe files and monitor windows services. As far as I could tell, Nagios is only capable of keeping track of process and service uptime, and does not have any sensors for specific applications.
- Reports and Graphs of Historic Trends: For PRTG, there are a number of custom graphs and reports that come prepackaged with the product. There is also a massive yet simple report building tool that can aggregate just about any data you could need in a more organized and relevant manner. Nagios actually has quite a large selection of report screens as well, that are slightly customizable. If you take the time, you can configure your own report screens and layouts as well, but you do not quite have the freedom that exists with the PRTG report configuration methods.
- Mobile App Support: PRTG is browser based, so apps are not necessary. That being said, there is an app for PRTG on both Android and IOS if you desire, and they are both given high reviews. Nagios is also accessible via web browser, although there is a specific module you can download that features a lightweight, mobile version of the Nagios web panel. There are no apps available for Nagios.
Conclusion
In summary, PRTG is easier to use and simply has more features than Nagios. PRTG also has a cleaner, nicer feeling UI than Nagios, and features a more in-depth tutorial. While Nagios will have less overhead than PRTG due to the size and platform it’s running on, I would say that the features PRTG offers and the ease of use / visual benefits would absolutely outweigh that fact, and this is immediately evident in a side by side comparison.
Another plus for PRTG is that you can upgrade to a higher tier license by paying just the difference between the current license and the higher license. PRTG also offers free support with one business day response times Monday through Friday.
Nagios, on the other hand, does pricing by the node count. You may pay an extra sum to upgrade to an enterprise grade version, which unlocks Capacity Planning, SLA reports, Bulk Modification, and other features not available in the standard one. Nagios support is not free, and will cost considerably more per year depending on node count. You can also do a 5 or 10 call support plan, as well as a 5 or 10 email support plan for quite a good amount of cash.
PRTG is absolutely the better option, and I highly recommend you download the 30-day Free Trial Version and see for yourself how intuitive and expandable the product is.


