Network monitoring or IT management software provides a centralized view of all the devices in an organization’s infrastructure, making it easier for administrators to identify problems and respond quickly. There are many software available in the market you can choose from but here we will talk about ManageEngine OpManager.
ManageEngine OpManager is a popular monitoring and management solution that can be used to monitor networks, servers, virtual environments, and applications. It provides a centralized console for managing IT infrastructure and applications from one location. It enables the user to get an overview of the network or application health status in real-time and also provides a dashboard for reporting on issues.
Below we have listed some of its key features, strengths, and limitations. Also, we shared the pricing plans to check if it meets your budget requirements. Follow our beginner’s guide to learn more about the product and to see if it suits your business needs.
What is ManageEngine OpManager?
ManageEngine OpManager is a powerful IT management software that helps IT managers to monitor their entire network and manage their assets. With the help of this tool, an IT team can keep an eye out for any system failures and prevent downtime from happening.
It provides real-time and deep visibility and analysis into network devices, wide area networks or VoIP links, servers, virtual servers, and switches. It is an easy-to-use monitoring tool that detects faults, identifies the root cause, and fixes it before it affects the operations.
Many large businesses with complicated multi-site networks prefer this type of tool to check on the health of network devices and reduce the expense of maintaining support at all locations.
With OpManager, it is now easier to track the health of all your network devices, get visibility into the patterns of network traffic, automate the network changes and configuration management, analyze and fix problems in your network, as well as monitor and fix performance.
Designed for multi-vendor enterprise IT networks, it is a comprehensive system with a lot of live statistics panels. You can also monitor the performance, traffic, firewall, configuration, and port management of the switches.
Additionally, organizations can monitor networking devices like routers, switches, firewalls, load balancers, wireless LAN controllers, servers, virtual machines, printers, storage devices, etc.
Compared with other networking and server monitoring software, ManageEngine OpManager offers by far the most complete set of monitoring tools, covering modules from Network, Server, NCM, Netflow, and IPAM, through to Auto-Detection, Asset Management, Fault Management, and Data Center Management.
Why Choose ManageEngine OpManager?
ManageEngine OpManager is a powerful and affordable solution for IT management. It offers a comprehensive set of features to monitor, manage, and troubleshoot your IT infrastructure. Here are a few main reasons why you must choose ManageEngine OpManager over other monitoring tools available in the market.
- Increased Visibility With OpManager, users can keep track of networks, analyze bandwidth, and manage firewall logs, configuration, switch ports, and IP addresses from a single location with greater visibility. Users can easily track App-wise Traffic NetFlow traffic and configuration data with the help of this tool. The tool makes it easier to identify the root cause of the problem and fix it before it causes any negative impact on operations.
- Offers Full Control Users gain full control over the network devices and can easily carry out tasks like executing commands, modifying configurations, or blocking access rights. You have full control and access over network vulnerabilities and performance issues.
- Automates Repetitive Tasks ManageEngine OpManager is an all-in-one IT management solution that helps you monitor, manage and maintain your IT infrastructure. It automates repetitive tasks and provides insights on performance, configuration changes, and more. It is a complete IT management solution that can be deployed in minutes with the help of a single installer.
- Saves on Maintenance The use of OpManager can save on maintenance costs by minimizing downtime and reducing the amount of time spent on routine tasks. The tool supports integration with all network management modules.
- Affordable Licensing Model OpManager has a device-based licensing strategy, in contrast to other network management vendors.
Interface And Features Overview
OpManager is mostly focused on infrastructure management, but also gives IT pros a few nice features for managing app performance and monitoring networks.
- VoIP Monitoring VoIP monitoring is a type of surveillance that monitors and records voice conversations over the internet by using VoIP software. VoIP is a technology that converts voice signals into packets of data and transmits them over the internet to their destination. ManageEngine OpManager supports VoIP monitoring that helps detect VoIP problems faster. It also allows users to track packet loss, MOS, latency, and other areas from a single location.
- Network Configuration Management (NCM) OpManager’s NCM feature is great for organizations when managing devices from different vendors and manufacturers. Network Configuration Management (NCM) is the process of managing and configuring a network. It includes the installation of hardware and software, monitoring, and maintenance. You can automate the repetitive task of deploying configuration and scripts with OpManager. Also, it eliminates the chance of human error by providing the benefit of Zero Touch Provisioning with only a click.
- IP Address Management (IPAM) IP Address Management (IPAM) and Switch Port Mapping (SPM) ease the regular task of recording devices and IP inventory on a database. It generates a complete inventory of IP addresses and mapped devices. Also, it records MAC addresses and DNS. Additionally, it will provide you with real-time data on the total number of IP addresses that are Used, Transient, and Available.
- Cisco Monitoring You can use OpManager to monitor the performance, traffic, firewall, configuration, and switch port management if you have Cisco devices installed in your network. It has a built-in system that enables users to track performance metrics including memory and CPU usage, packet drops, CRC problems, etc. To monitor blade servers and virtual machines, you can also use VMware monitoring.
- Bandwidth Analysis and NetFlow Monitoring The bandwidth Analysis feature helps track the traffic and bandwidth usage covering IPfix, jFlow, NetFlow, QoS, CBQoS, Billing, Attacks, etc. With its WLC module, it not only provides traffic monitoring but also visibility into your wireless network and identifies the top users.
- Network mapping OpManager offers network mapping that helps in analysis, planning, and design. The SNMP responses received from the device agents give a quick update to the manager about the device and its existence. As a result, you can create equipment inventory without any assistance from humans. This feature helps create a visual representation of the connections between nodes and updates inventory and the network topology in real-time. Even the movement of equipment can be easily seen through this amazing feature supported by the tool.
- Real-time network monitoring OpManager is less used for keeping track of traffic patterns, but to check on the statuses of network equipment. The main responsibility of OpManager is network monitoring that relies on the Simple Network Management Protocol (SNMP). The protocol helps collect device status and displays it in a graphical and statistical format. The generated reports later help monitor the network for latency, packet loss, throughput, and other metrics.
The benefit of real-time network monitoring is that it can help identify issues as they happen and react to them more quickly than traditional methods. Using the tool, you can monitor the performance of a network and run an analysis to identify any potential issues.
Integrations
OpManager’s integration capabilities are fairly constrained. Integration with third-party tools like NetFlow Analyzer, Slack, ServiceNow, Jira ServiceDesk, Firewall Log Monitor, AlarmsOne, etc. helps in improving the overall user experience. The tool allows easy integration with various Manage Engine and third-party applications. Webhooks enable OpManager to connect to numerous platforms, including Telegram, Zoho Flow, PagerDuty, Zapier, and Microsoft Teams.
Strengths of ManageEngine OpManager
ManageEngine OpManager is a monitoring software that offers a range of features for system administrators. It is one of the most popular monitoring tools in the market today. Here are a few strengths associated with ManageEngine OpManager:
- Easy to Install and Configure OpManager is quite easy to install and configure compared to other tools. No matter whether you are willing to install the product as a service or for using the built-in MySQL, it will hardly take any time to install. Users can also create templates and adjust monitoring settings.
- IT Workflow Automation IT Workflow Automation is a process of improving the efficiency and effectiveness of your IT department by automating tasks that can be done without human intervention. OpManager supports IT Workflow Automation and helps reduce the cost, time, and effort required for everyday IT tasks. It helps find the root cause of the problem and focuses on minimizing downtime.
- Supports Script Monitoring Script monitoring is a process where the content is monitored and checked for plagiarism, grammar errors, and other mistakes. OpManager supports Script monitoring and ensures that the content being used by the company or organization is original and error-free. OpManager combines all scripts into a single management panel so that users can easily distribute scripts across all of your servers. It also alerts on script results and enables users to set up thresholds that may help start automated processes to fix issues.
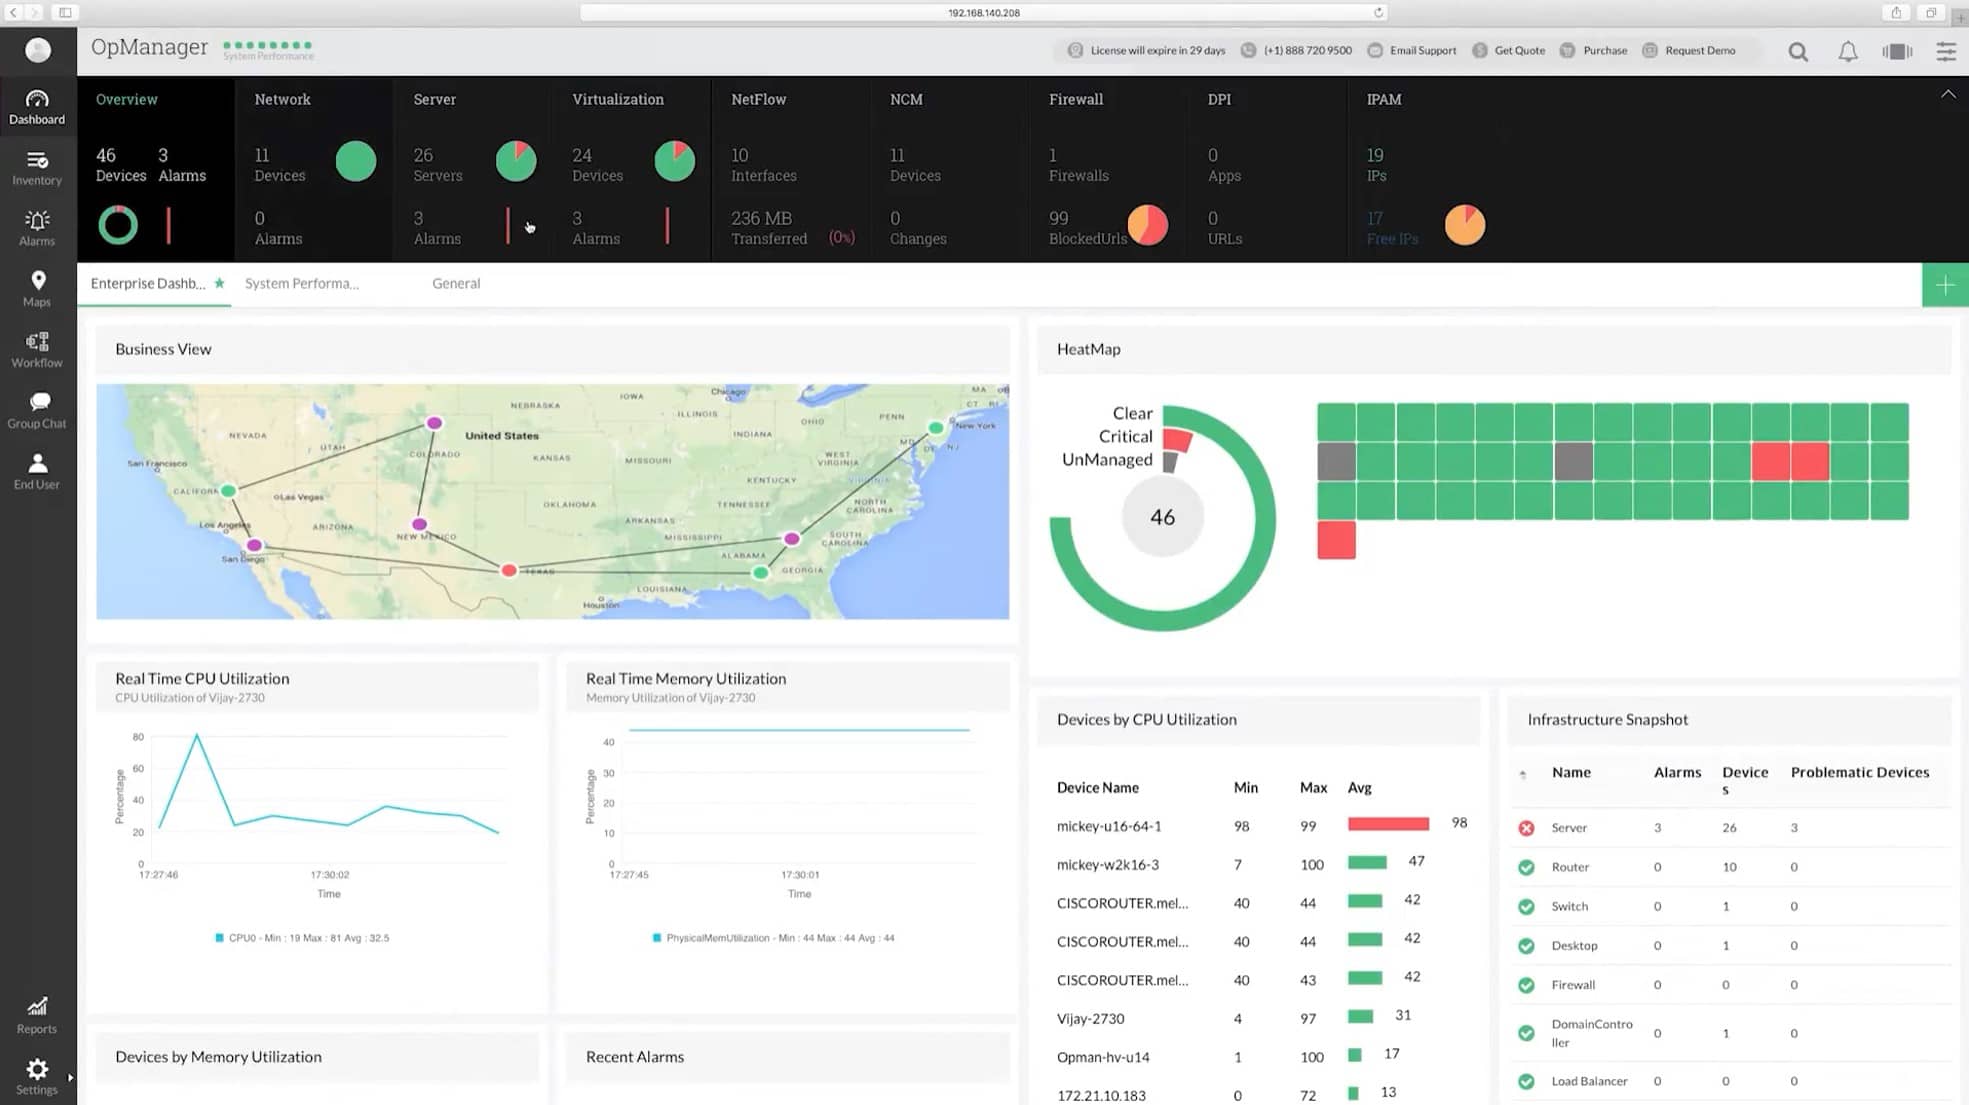
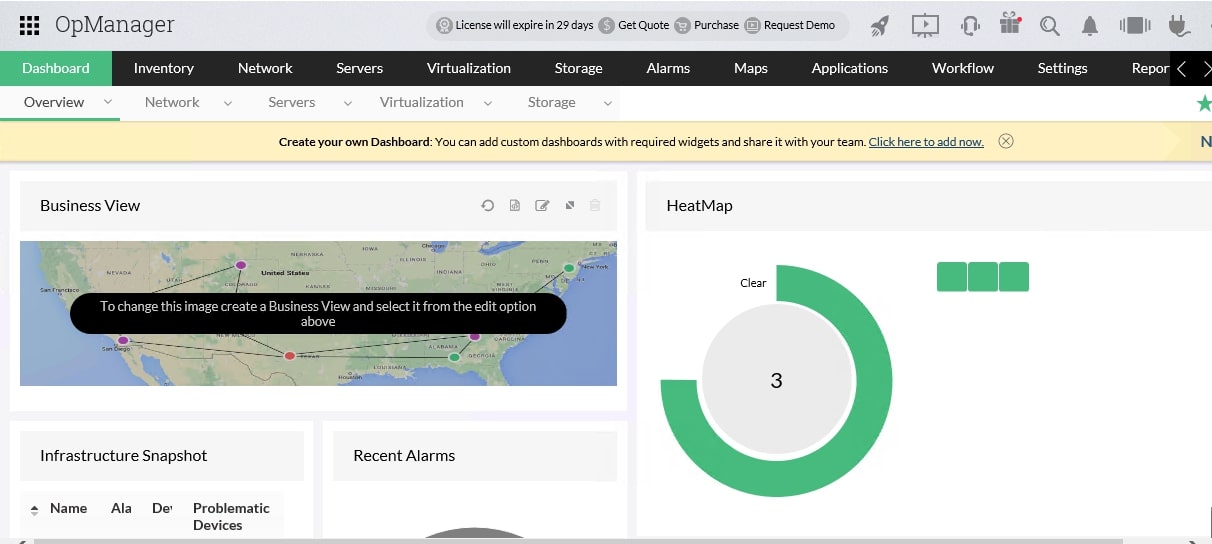
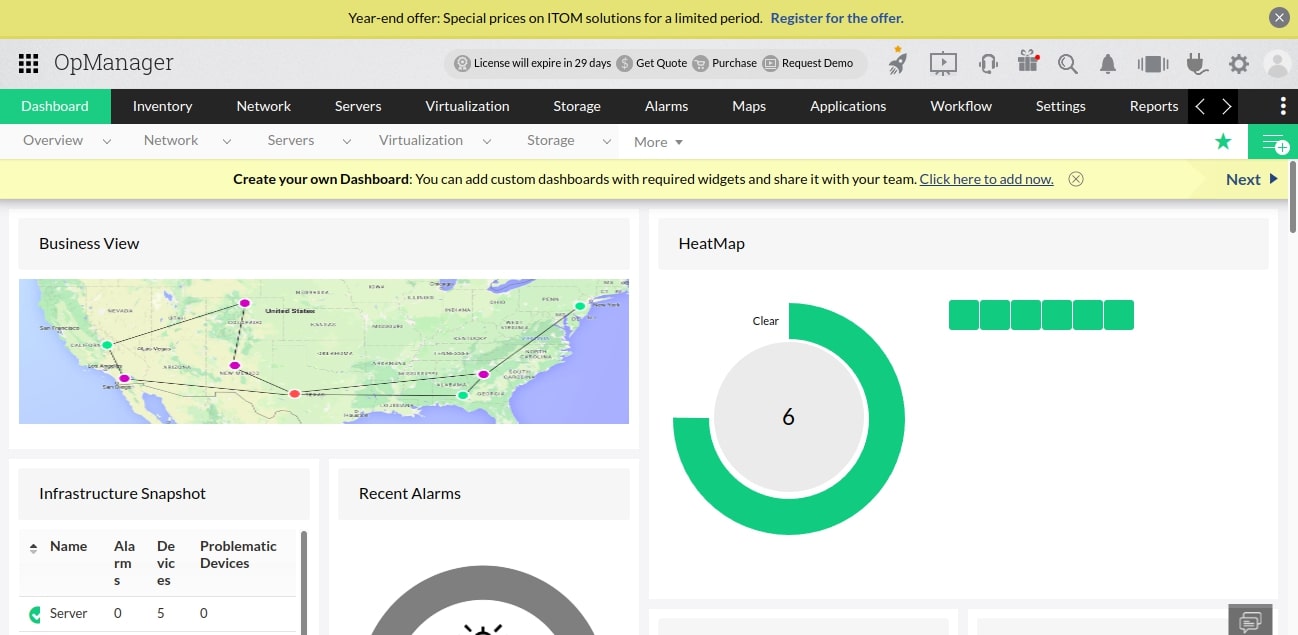
- Customizable Dashboards The customizable dashboard gives a quick overview of the network. It also supports widgets that can be added, deleted, or customized as per the need when displaying data. It is good for troubleshooting and allows you to keep a check if a server is running out of disk space or if your internet connection is overloaded.
Limitations of ManageEngine OpManager
No doubt, OpManager has a lot of benefits compared to other tools in the market, but at the same time, it offers certain limitations. For instance, it is pretty much scattered to reach the discovery mapping feature, a user will require to go all the way down to the “Settings” gear icon to locate it. Further, it supports limited integrations and is somewhat expensive.
The user must purchase a license and pay for the annual maintenance service to use the product. It might not be a suitable fit if you are a service company that is just getting started. However, if you work for a huge company, you might prioritize usefulness over cost.
ManageEngine OpManager Editions and Pricing
If you are planning to invest in ManageEngine OpManager, you can try the free edition or choose from the quote-based plans. The free edition includes access to 3 devices, two users, and a few basic monitoring features. However, the paid plans supported by the tool are available in three packages – Standard, Professional, and Enterprise.
The standard package costs around $245 for 10 devices. The package offers network discovery, CSV discovery, Interface Monitoring, WMI Monitoring, CLI monitoring, Script Monitoring, Syslog Monitoring, Cisco ACI Monitoring, Local Authentication, and business views. It also offers alarm monitoring and escalation. Additionally, the standard package is compatible with Android and iOS Mobile apps.
The Professional package starts at $345 for 10 devices and includes all features of the standard package. Further, it offers Discovery Rule Engine, schedule discovery, VMware Monitoring, Hyper-V Monitoring, UCS Monitoring, IT Workflow Automation, MS SQL Monitoring, Hardware Monitoring, and more. Under User management, it includes AD Based Authentication, Rest API Access, Radius Authentication, and Pass Through Authentication.
Along with the custom dashboards, administrators can also access Real-Time Widgets and NOC View. For maps, it covers Zoho Maps Integration, 3D Datacenter View, and Virtual Environment Maps along with Business Views. Users can also schedule reports and create forecasting reports with the professional edition.
The Enterprise edition is the most expensive one and costs around $11,545 for 250 devices. It includes all features available in the professional edition plus distributed network monitoring and raw data maintenance for 180 days.
For add-ons, check the official page and get more information on the product. Also, the number of devices that will be monitored determines the OpManager license options. All the device’s interfaces, nodes, and sensors are covered by the license. In contrast to other tools, a device can contain any number of interfaces, components, or sensors with ManageEngine OpManager.
How to Install ManageEngine OpManager
In this section, we will show you how to install ManageEngine OpManager on Windows and Linux operating systems.
System Requirements
| No. of Devices | Processor | Memory | Hard Disk |
|---|---|---|---|
| 1 to 250 | Intel Xeon 2.0 GHz 4 cores/ 4 threads | 4 GB | 20 GB minimum |
| 251 to 500 | Intel Xeon 2.5 GHz 4 cores/ 8 threads | 8 GB | 20 GB minimum |
| 501 to 1000 | Intel Xeon 2.5 GHz 4 cores/ 8 threads or higher | 16 GB | 40 GB minimum |
Check out the ManageEngine official documentation for detailed information on system requirements.
Install ManageEngine OpManager on Windows
Follow the below steps to install OpManager free edition on Windows.
Step 1 – First, download the OpManager free edition from their official download page.
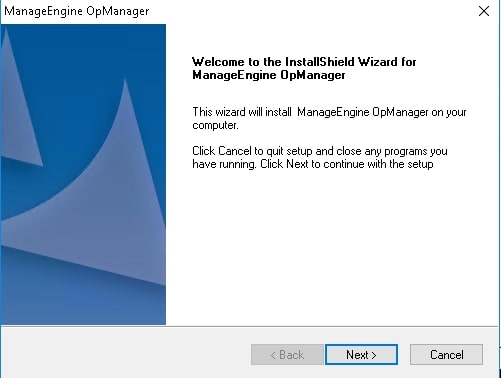
Step 2 – Double-click on the downloaded file to start the installation.
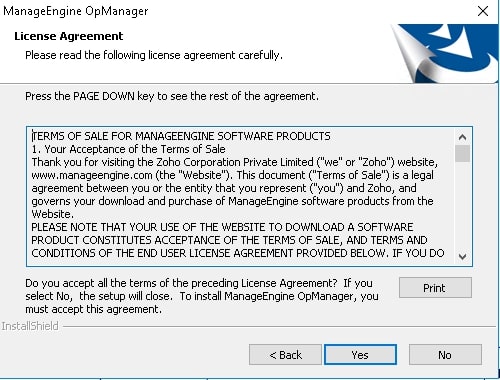
Step 3 – Click on the Next button. You should see the License agreement page.
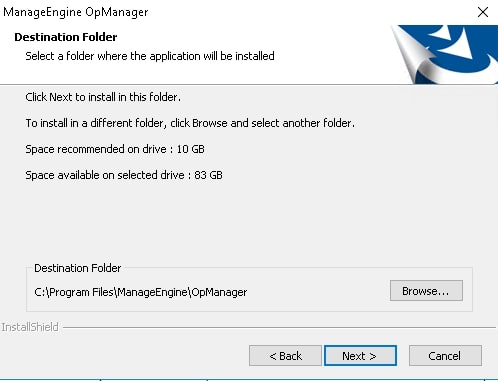
Step 4 – Click on Yes to accept the license agreement. You should see the destination folder selection page.
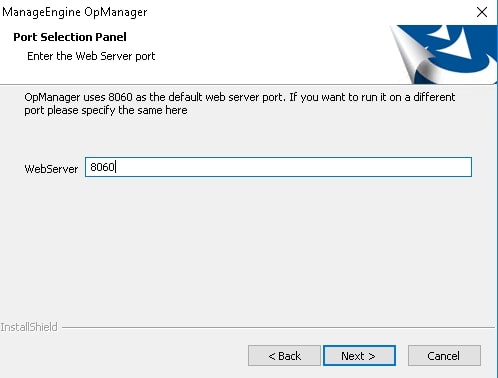
Step 5 – Define your destination install folder and click on the Next button. You should see the port selection page.
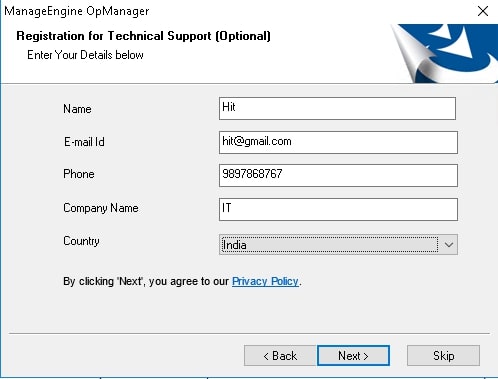
Step 6 – Define your port number and click on the Next button. You should see the registration page.
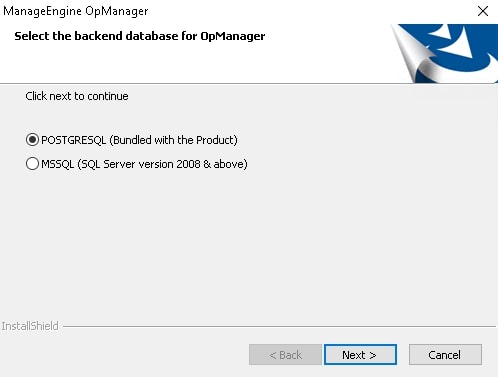
Step 7 – Provide all the required information and click on the Next button. You should see the database selection page.
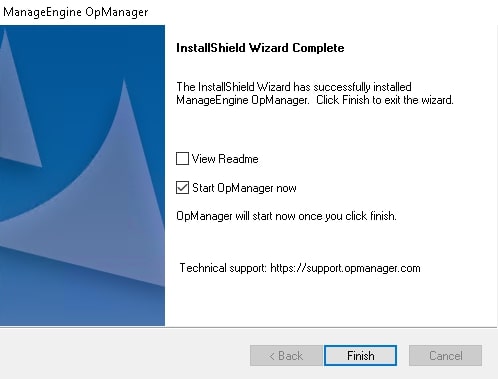
Step 8 – Select your database and click on the Next button. Once the installation is finished. You should see the following page.
Step 9 – Click on the Finish button to close the installation screen.
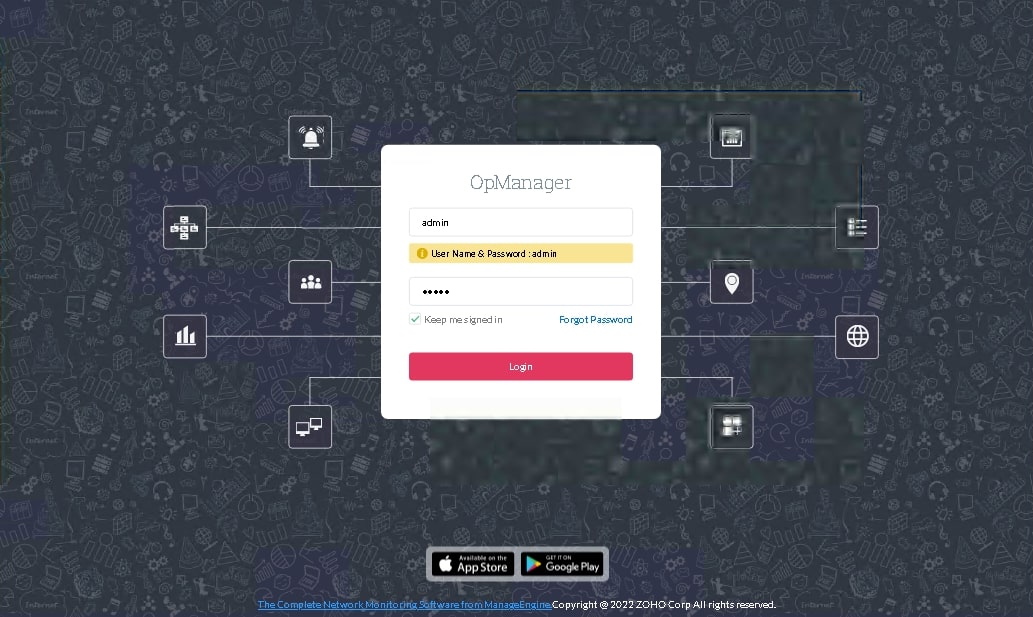
Now, open your web browser and access the OpManager web interface using the URL http://your-server-ip:8060. You should see the OpManager login screen.
Provide the default username and password as admin/admin then click on the Login button. You should see the OpManager dashboard on the following screen.
Install OpManager on Linux
Follow the below steps to install OpManager free edition on Linux.
Step 1 – Download the OpManager free edition for Linux.
Step 2 – Set executable permission on the downloaded file.
chmod a+x ManageEngine_OpManager_64bit.bin
Step 3 – Run the following command to start the OpManager console-based installation.
./ManageEngine_OpManager_Free_64bit.bin -i console
You will be asked to install OpManager on your system as shown below:
=========================================================================
Introduction
------------
Welcome to the InstallAnywhere Wizard for ManageEngine OpManager
A comprehensive Network, Systems, and Applications Management product that is
easy-to-install, easy-to-use, and extremely affordable.
For help on installation, refer to
https://www.manageengine.com/network-monitoring/installing_opmanager.html
The InstallAnywhere Wizard will install ManageEngine OpManager on your
computer. To continue, click Next.
PRESS  TO CONTINUE:
Press the Enter key to start the installation. You will be asked to accept the license agreement and define port:
===============================================================================
DO YOU ACCEPT THE TERMS OF THIS LICENSE AGREEMENT? (Y/N): Y
Do you want to register for technical support?(Y/N) (Default: Y): N
Default Install Folder: /opt/ManageEngine/OpManager
ENTER AN ABSOLUTE PATH, OR PRESS  TO ACCEPT THE DEFAULT
Enter the Web Server Port Number (Default: 8060):
Once the installation has been completed, you will get the following output.
===============================
Pre-Installation Summary
------------------------
Please review the following before continuing:
Product Name:
    ManageEngine OpManager
Install Folder:
    /opt/ManageEngine/OpManager
Disk Space Information (for Installation Target):
    Required:  647.77 MegaBytes
    Available: 75,211.99 MegaBytes
PRESS  TO CONTINUE:
Installation Completed
Congratulations! ManageEngine OpManager has been successfully installed to:
/opt/ManageEngine/OpManager
Step 4 – Next, start the OpManager service with the following command:
systemctl start OpManager.service
You can also check the status of OpManager with the following command.
systemctl status OpManager.service
You will get the following output.
● OpManager.service - OpManager As Service
     Loaded: loaded (/etc/systemd/system/OpManager.service; enabled; vendor preset: enabled)
     Active: active (exited) since Sat 2022-12-17 02:15:00 UTC; 7s ago
    Process: 11478 ExecStart=/opt/ManageEngine/OpManager/bin/na_service start (code=exited, status=0/SUCCESS)
   Main PID: 11478 (code=exited, status=0/SUCCESS)
      Tasks: 25 (limit: 4685)
     Memory: 192.1M
     CGroup: /system.slice/OpManager.service
             ├─11505 ./wrapper ../conf/wrapper.conf wrapper.pidfile=.//OpManager.pid wrapper.daemonize=TRUE
             └─11562 /opt/ManageEngine/OpManager/jre/bin/java -Dcatalina.home=.. -Dserver.home=.. -Dserver.stats=1000 -Djava.util.logging.man>
Dec 17 02:14:59 ubuntu2004 systemd[1]: Starting OpManager As Service...
Dec 17 02:15:00 ubuntu2004 systemd[1]: Finished OpManager As Service.
Dec 17 02:15:07 ubuntu2004 su[11591]: (to postgres) root on none
Dec 17 02:15:07 ubuntu2004 su[11591]: pam_unix(su-l:session): session opened for user postgres by (uid=0)
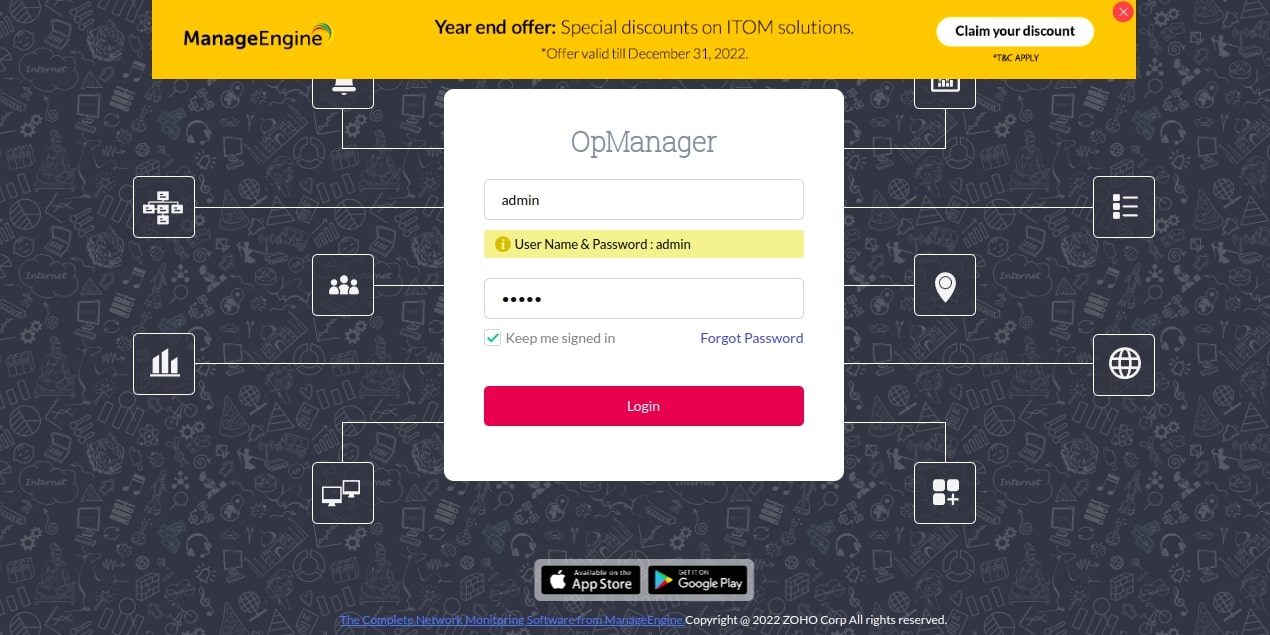
Now, open your web browser and access the OpManager web interface using the URL http://your-server-ip:8060. You should see the OpManager login page.
Provide the default username and password as admin/admin then click on the Login button. You should see the OpManager dashboard on the following screen.
Conclusion
ManageEngine OpManager covers everything from monitoring the performance of your servers to managing your virtualization infrastructure. It also provides insights about your users and devices, as well as the security of your data.
It is a powerful network, systems, and application management tool that allows organizations to monitor their network performance, identify real-time network issues, fix the issues, and avoid downtime.
To be more precise, OpManager is a software solution for the maintenance of IT infrastructure. It is used to monitor and manage the performance of servers, storage, and networks.
If you are a legacy customer with a limited budget, ManageEngine OpManager is a great choice, as it is an extremely easy-to-deploy, monitor, and provision device. You can also manage alerts, notifications, log tracking, reports, and SLAs.
Apart from offering full visibility, the product offers full control and automates repetitive tasks. It provides quick insight into the network performance, configuration changes, and other areas that require immediate attention.
OpManager can be deployed in any size environment. It is a modular solution that allows you to manage the IT infrastructure at different levels of sophistication – from small businesses to large enterprises with tens of thousands of assets.
VoIP monitoring, Network Configuration Management (NCM), Bandwidth Analysis, NetFlow Monitoring, Wireless network monitoring, Virtual server monitoring, Syslog monitoring, etc. are a few activities for which you can use OpManager. Above we have also listed the strengths and limitations of ManageEngine OpManager in detail.
Also, look out for the pricing plans, supported integrations, and other details before making any final decision.

