Internet Protocol Flow Information Export, or IPFIX in short, is an IETF standard that was created to monitor and export the flow of information across routers, switches, and other network devices. IPFIX is a common and universal standard that works well across most devices.
In general, every IPFIX tool performs the following functions:
- Allows the flow of data from any IPFIX-enabled device
- Unpacks the binary data flowing through the device and converts it into text and numeric formats
- Uses selective filtering and aggregation techniques to reduce data volume
- Stores the data in SQL database or in flat files
These functions can be broadly categorized into exporter, collector and analyzer. Exporter tracks key information about IP packets, encapsulates the same into UDP and sends them to a collector. In turn, the collector process this data from an exporter and stores it in database or flat files.
Finally, the analyzer converts this data into graphical and visual forms to help network engineers get valuable insights about network performance, monitoring, troubleshooting and more.
The Best IPFix Collectors & Analyzers
Methodology for selecting the best IPFix collectors and analyzers
With the help of these tools, you can easily track and export data flow across switches, routers, and different network devices. You can even convert the binary data flowing through the device into text and numeric formats after unpacking it. There are many benefits of using IPFix collectors and analyzers, but at the same time, it is necessary to choose the right one.
We have listed a few methodologies that you must consider when selecting the IPFix analyzers and collectors:
- Great interface and can generate customizable reports for analysis
- Allows tracking network usage, bandwidth as well as resources
- Compatible with different platforms and protocols or restricted to specific ones
- Quick insights and tracks IPFIX flow traffic in real-time
Let’s take a detailed look at these IPFIX tools and Software and see what they have to offer!
1. ManageEngine NetFlow Analyzer – FREE TRIAL
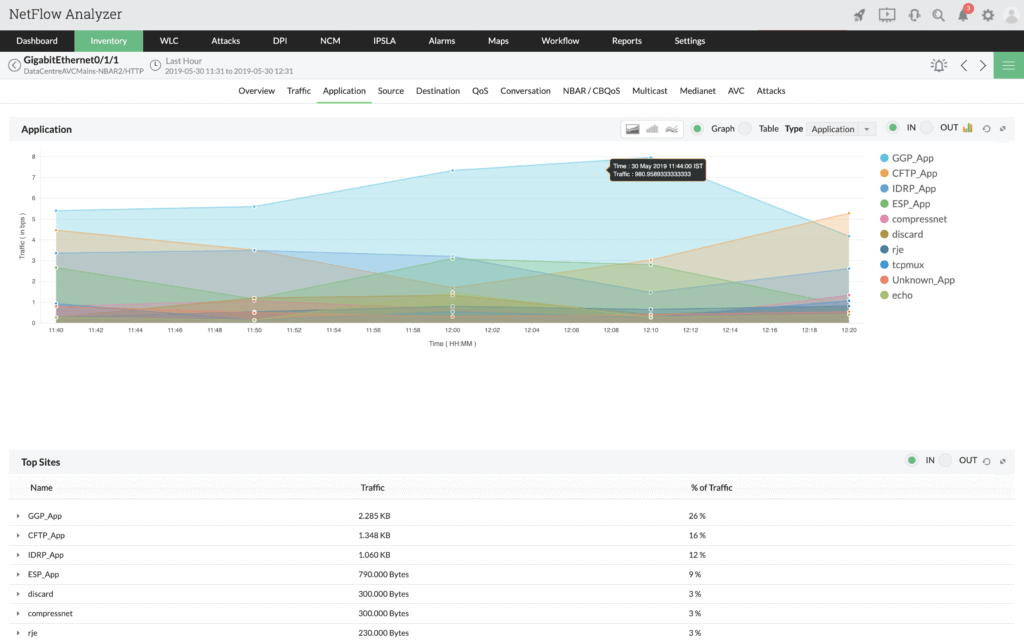
ManageEngine NetFlow Analyzer is a great tool for monitoring your IPFIX flow traffic within a single dashboard. It provides great visibility into your network traffic, and allows you to parse IPFIX flow information to ensure your network is flowing smoothly and without any hiccups.
Key Features:
- Real-time reports, graphs and alarms
- Program, application and protocol monitoring options
- Customize your dashboard to show important protocols and programs to monitor
- Grouping & billing options
- QOS monitoring
- IP SLA & WLC monitoring capabilities
Why do we recommend it?
ManageEngine NetFlow Analyzer is a holistic tool that centralizes IPFIX flow traffic monitoring in a singular dashboard, delivering real-time reports and insights. The ability to customize dashboards and comprehensive monitoring options makes it invaluable for network oversight.
Who is it recommended for?
This solution is apt for network engineers, IT managers, and businesses wanting a detailed, real-time look at their network’s flow traffic. Its customizable features also make it suitable for those who prioritize QOS monitoring, IP SLA, and WLC monitoring within their networks.
Pros:
- Single dashboard to track IPFIX flow traffic
- Insightful reports with graphs and sends alerts in real-time
- Tracks all programs, applications, and protocols
- Customize dashboard and perform QOS monitoring
- Monitors IP SLA and WLC
Cons:
- Not a right fit for small home networks as it was built for enterprise use.
You can download a 30-day free trial.
EDITOR'S CHOICE
ManageEngine NetFlow Analyzer is our top pick for an IPFIX collector and analyzer for network flow data because this system includes a discovery service that automatically sets up the bandwidth monitoring console without you having to manually enter the addresses of all of your network devices. This system can also communicate with NetFlow, sFlow, J-Flow, Netstream, and AppFlow. The system can examine voice traffic for quality of service (QoS) statistics and help improve issues such as jitter, lag, and lost packets. The service will help you to remove these problems, which are the consequences of overloaded switches. With the detailed breakdown of activity on your network, you will be able to see where all of your traffic is coming from. You will be able to shift tasks to run out of peak hours to get better performance out of your network and you will also be able to implement queuing to allow interactive protocols through switches faster, holding up non-critical traffic for a few seconds.
Download: Get a 30-day free trial
Official Site: https://www.manageengine.com/products/netflow/download.htm
OS: Windows Server, Linux, and AWS
2. Site24x7 – FREE TRIAL
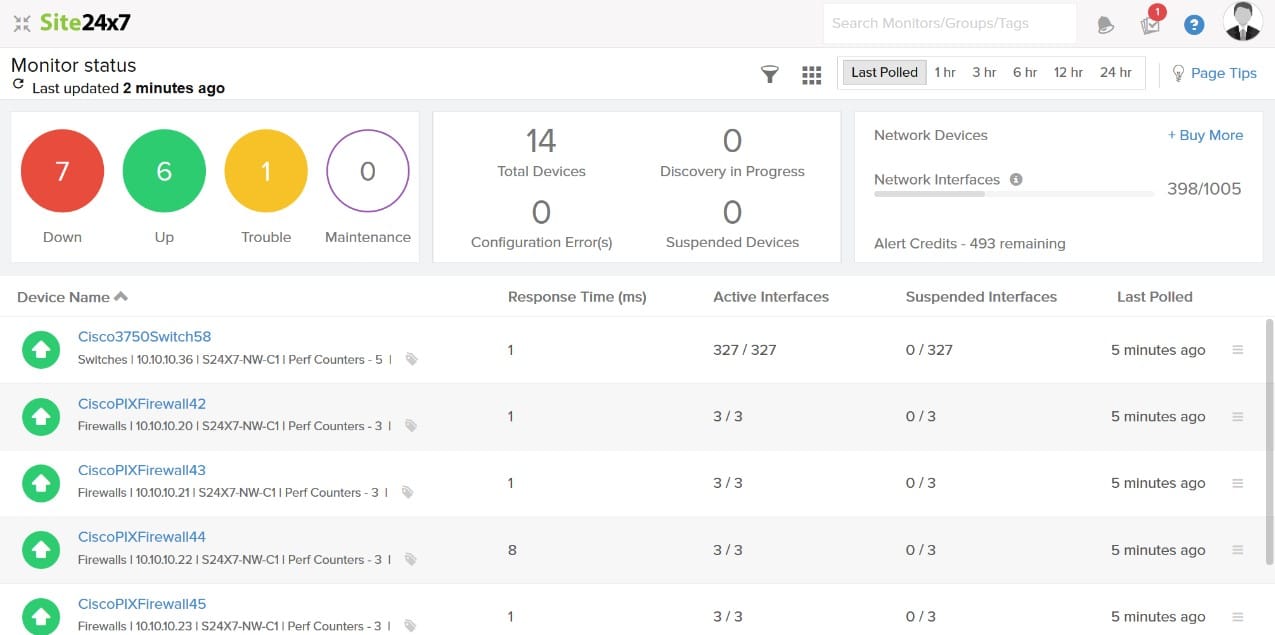
Site24x7 is a packaged solution that offers access to monitoring websites, networks, and application performance. Site24x7 Network Monitoring is one of its modules that helps administrators gain insights into network traffic and bandwidth usage in real time and troubleshoot issues faster. Users can even access the dashboard using any common web browser because it is a cloud-based service. However, it does require deploying an agent on site to handle all the processing.
Key Features:
- Traffic flow analysis
- Full-stack monitoring
- Anomaly detection and detailed reporting
- Network bandwidth monitoring
- Network mapping
Why do we recommend it?
Site24x7 allows administrators to easily track and analyze traffic flows and prevent issues. Furthermore, the robust tool offers complete visibility into the networks and supports different technologies like NetFlow, sFlow, J-Flow, etc., that help extract statistics from network devices.
It supports NetFlow, sFlow, J-Flow, and a wide range of other technologies to collect and track the traffic flow from multiple vendors. You can even create insightful reports on a regular basis by extracting tabular data or easily interpreting graphics. Further, it allows network administrators to export the reports in various formats.
Who is it recommended for?
Network Administrators, IT departments, and enterprises with complex network setups can make the most from Site24x7. Using this tool, professionals can better manage their network performance and resolve issues promptly.
Pros:
- SNMP trap processing and monitoring capabilities along with network mapping
- Alerts on detecting anomalies using emails, SMS messages, and push notifications
- Supports Jira, Microsoft Teams, Slack, and other platforms to route your alert notifications
- Integration with third-party tools and tracking up to 200 distinct vendor devices
Cons:
- Can be complex and comes with a wide range of features that may take users a while to understand and explore
You can register for a 30-day free trial.
3. Plixar Scrutinizer
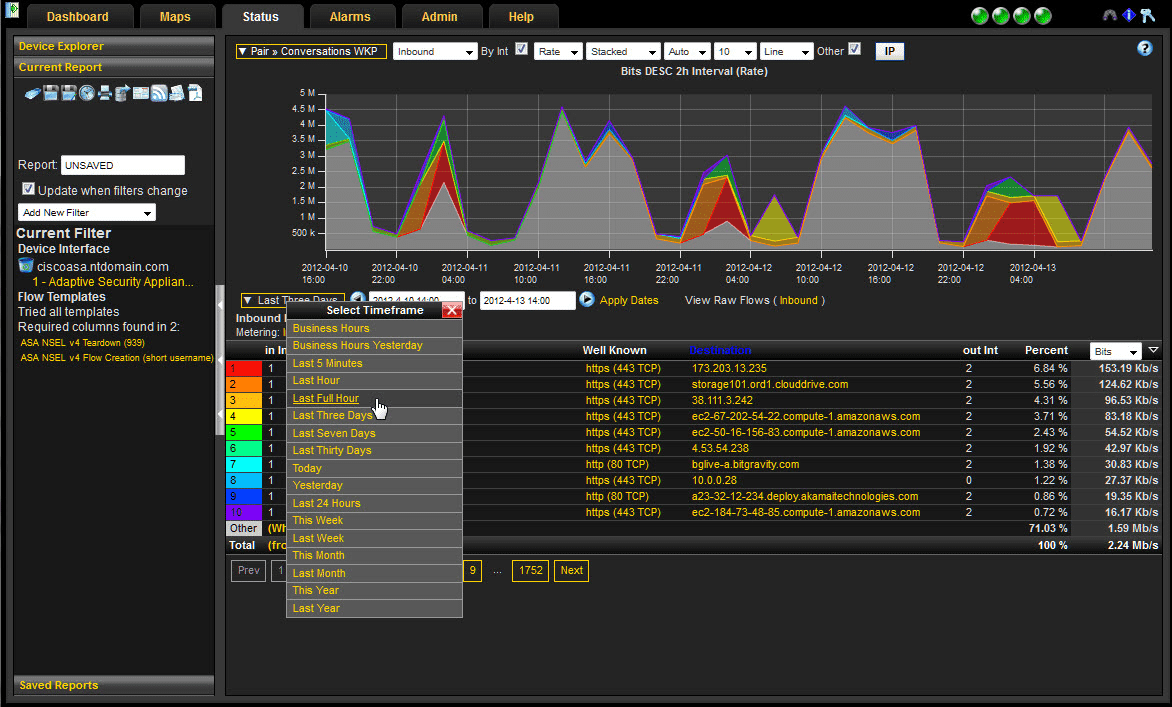
Plixar scrutinizer is a powerful and scalable solution that thoroughly analyzes the data and provides rich insights on it.
Key Features:
- Collects metadata and traffic flows from all the network packets and stores them in a database
- Advanced filters to give deep insights into data
- Sophisticated reporting tool gives the right data at the right time to help business owners make appropriate decisions
- Rapid delivery of insights increases efficiency and reduces cost for businesses
- End-to-end visibility to help identify the root cause of any problem
- Scales easily to match network growth
- Fast time-to-resolution during security breaches
- Proactive approach to security
- Supports many flow technologies such as Netflow, sFlow, IPFIX, JFlow, Netstream and more
- Works well on VMware, Hyper-V 2012 and KVM
- Public and private cloud deployments are available
Why do we recommend it?
Plixar Scrutinizer stands out due to its advanced analytical capabilities, providing deep insights from metadata and traffic flows. With its sophisticated reporting, proactive security approach, and adaptability to both network growth and multiple flow technologies, it proves to be an asset for businesses seeking efficient and detailed network analysis.
Plixar Scruitinizer comes in four plans; free, MDX, SSRV and SCR. The table below gives the features available under each plan.
Description Free MDX SSRV SCR
| Flows Collected Per Second | 10K | 10K | 10K | 40K / Up to 10+ Million |
| Length of time raw flows are kept | 5 hours | 24 hours | Unlimited | Unlimited |
| Days of historical flow roll ups | 1 week | Unlimited | Unlimited | Unlimited |
| Number of Flow Exporters Supported | Unlimited | Pay by device | Pay by device | Pay by device |
| Flexible Licensing | Limited | Yes | Yes | Yes |
| Advanced Reporting on all vendor specific exports | Yes | Yes | Yes | Yes |
| Full Stitching and Deduplication | Yes | Yes | Yes | Yes |
| 3rd party integration (E.g. Splunk, Elastic Search, etc.) | Yes | Yes | Yes | Yes |
| Support for all versions of NetFlow, IPFIX, sFlow, etc. | Yes | Yes | Yes | Yes |
| Support for all vendor enterprise IPFIX elements | Yes | Yes | Yes | Yes |
| Ability to create filters to narrow in on traffic | Yes | Yes | Yes | Yes |
| All exporters index search for a host | Yes | Yes | Yes | Yes |
| Scheduled Emailed Reports (HTML & PDF) | No | Yes | Yes | Yes |
| Scheduled Email Top Interfaces | No | Yes | Yes | Yes |
| Export Data in CSV format | No | Yes | Yes | Yes |
| Saved Reports | No | Yes | Yes | Yes |
| Access to API | No | Yes | Yes | Yes |
| Report Designer to build new reports from flows | No | Yes | Yes | Yes |
| 8AM-5PM Eastern Time Technical phone support | No | Yes | Yes | Yes |
| Create Dashboards | No | Yes | Yes | Yes |
| Auto DNS Resolve host names | No | Yes | Yes | Yes |
| Configure and trigger notifications | No | No | Yes | Yes |
| CSV export of Tables (e.g. Alarms, Status, etc.) | No | No | Yes | Yes |
| Flow Hopper to show flow path – hop to hop | No | No | Yes | Yes |
| Set thresholds in saved reports to monitor traffic | No | No | Yes | Yes |
| Define IP Groups and Report | No | No | Yes | Yes |
| Multi Tenancy Module – keep selected data private | No | No | Yes | Yes |
| Threat Detection Algorithms | No | No | Yes | Yes |
| Business Hours Based Reporting | No | No | Yes | Yes |
| ASA ACL Descriptions | No | No | Yes | Yes |
| AWS Kinesis Streaming | No | No | Yes | Yes |
| Cisco : Source Fire eStreamer | No | No | Yes | Yes |
| LDAP, Radius, Tacacs Authentication Support | No | No | Yes | Yes |
| Number of login accounts | 2 | 5 | Unlimited | Unlimited |
| Number of security groups | 2 | 5 | Unlimited | Unlimited |
| IP address to user name correlation support | No | No | Yes | Yes |
| Optional 7×24 technical support | No | No | Yes | Yes |
| Unified Distributed Collector Support | No | No | No | Yes |
Who is it recommended for?
Recommended for businesses and IT specialists desiring a comprehensive network monitoring solution. It is particularly suitable for those who need end-to-end visibility, quick insights during security breaches, and support for various flow technologies across both public and private cloud deployments.
Pros:
- Gathers all information related to the traffic patterns and metadata from each network packet and saves it in a database
- Built-in advanced features that provide in-depth analyses of the data
- Boost productivity and lower costs with its quick insights
- Facilitates quick time-to-resolution during security incidents
- Supports Netflow, sFlow, IPFIX, and other flow technologies
Cons:
- Uses a good portion of the system resources and requires you to speak with the sales team for price details
The price is customized for each plan and the free version can be downloaded.
4. SolarWinds NetFlow Traffic Analyzer
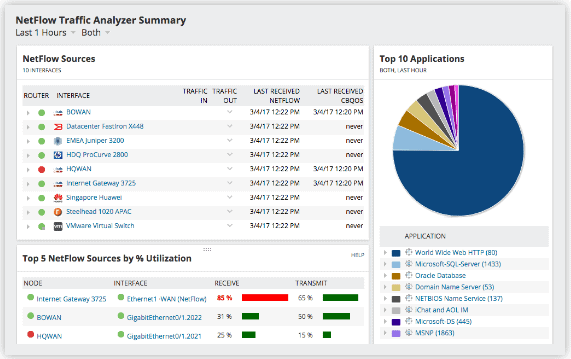
SolarWinds NetFlow Traffic Analyzer supports IPFIX, NetFlow, sFLow, J-Flow and Huawei Netstream protocols. It’s a comprehensive tool for collecting and analyzing information and is also a part of the larger Network Bandwidth Analyzer pack.
Key Features:
- Monitors the network to discover traffic patterns
- Works seamlessly with a range of different platforms
- Identifies which applications and protocols are consuming the maximum bandwidth
- Collects traffic data from all the network packets
- Changes data from network packets into useable formats
- Analyzes data and presents it in the form of meaningful reports, charts and graphs to users through a web-based user interface
- Comes with PerfStack, a performance analysis dashboard that allows users to drag and drop performance metrics on a timeline, to get a visual correlation of data
- Follows CBQoS policy optimization which means, it confirms that prioritized traffic coming from cloud or VoIP applications passes smoothly through the network
- WLC traffic monitoring helps to monitor wireless networks
Why do we recommend it?
SolarWinds NetFlow Traffic Analyzer offers comprehensive data collection and analysis, making it ideal for identifying bandwidth consumption and traffic patterns. With a user-friendly web interface and support for multiple protocols, it stands out as one of the best in its category.
Who is it recommended for?
This tool is recommended for network administrators and IT professionals looking to gain deeper insights into their network traffic, especially those interested in identifying bandwidth-intensive applications and ensuring smooth passage for prioritized traffic from cloud or VoIP applications.
Pros:
- Allows discovering traffic patterns by keeping track of the networks
- Highly compatible with different platforms and protocols, including NetFlow, sFlow, JFlow, etc.
- Determines which protocols and apps are using the most bandwidth
- Web-based user interface to analyze data and show it to users as meaningful reports, charts, and graphs
- Tracking WLC traffic aids in keeping an eye on wireless networks
Cons:
- Not the best choice for small LANs or home users, as it was designed for enterprises that process a lot of data
Try a free 30-day free trial – visit site for pricing information.
5. nProbe
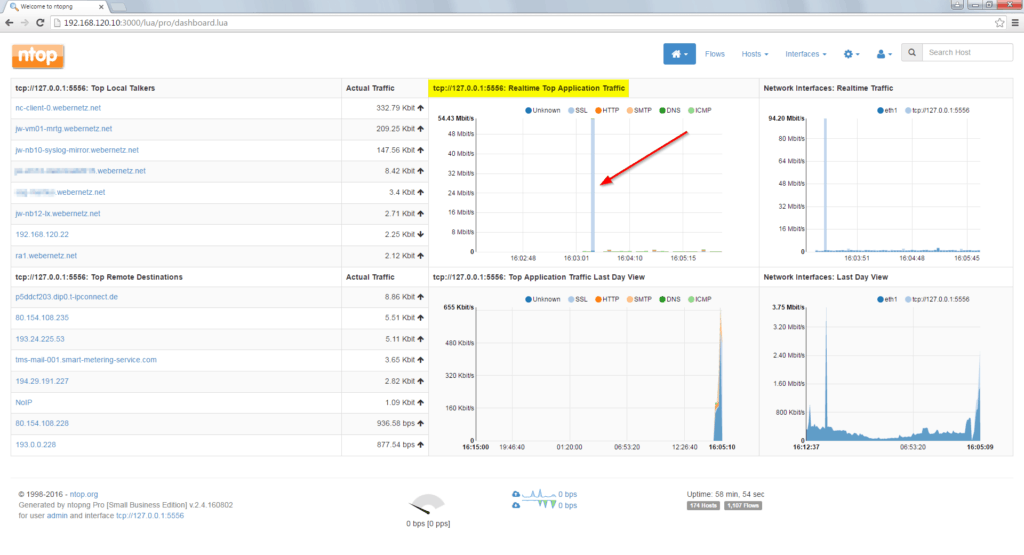
nProbe offers the same level of functionality for many flow streams, and this makes it ideal for large environments that have different monitoring environments. It is also ideal for bringing deprecated systems up to speed and at the same time, helps to save money and time for businesses.
Key Features:
- Collects and exports data from any device that can export in Netflow v5/v9 and IPFIX formats
- Works on Linux, Windows and other embedded environments
- Provides Layer 7 application visibility, so it can monitor more than 250 applications including popular ones such as Skype and BitTorrent
- Offers complete support for IPv4 and IPv6
- Consumes less than 2MB of memory, regardless of the network size
- Natively exports flows to Apache, Syslog, Kafka, Splunk and MySQL
- Collects sFlow flows and translates them to IPFIX or NetFlow
- Comes with a multi-threaded architecture for large systems
- Built-in VoIP traffic analysis
- Designed to run on environments that come with limited resources
- Option to save flows on disk for later analysis
- Can be used as a probe, probe and collector, collector or even a proxy, depending on the business needs
- Highly scalable and fully configurable
Why do we recommend it?
nProbe stands out for its versatility in handling multiple flow streams, making it invaluable for heterogeneous monitoring environments. Its efficiency, marked by consuming minimal memory regardless of network size, combined with its ability to seamlessly integrate with platforms like Apache, Syslog, and MySQL, establishes it as a top pick for businesses.
Who is it recommended for?
This tool is ideal for businesses operating in expansive environments or those with varying monitoring setups, including those with legacy systems. nProbe is also perfect for organizations that prioritize efficiency, scalability, and extensive application monitoring – from Layer 7 application visibility to built-in VoIP traffic analysis.
Pros:
- Collects and transfers info from any device that has IPFIX and Netflow v5/v9 export capabilities
- Fully supports IPv4 and IPv6
- Multi-threaded architecture that is suitable for large systems
- No matter how big the network is, it uses less than 2MB of memory
- Exports data natively to Apache, Syslog, and MySQL
Cons:
- Not a great option particularly for non-technical users as it is difficult to learn
nProbe comes in varying price structure. nProbe Embedded for ARM and Linux is priced at €49.95, nProbe Standard is €149.95, nProbe Pro with Plugin support is €299.95 and upgrade nProbe package from standard to pro is €149.95 respectively. nProbe is available at no cost for non-profit organizations and universities.
6. IsarFlow
IsarFlow is another good choice for monitoring IPFIX and NetFlow data. This network monitoring solution comes with a GUI-based personalized reporting tool, so each person can view the information that is important for them. Such a personalized approach makes IsarFlow ideal for individuals who work together to monitor a network.
Key Features:
- Collects, stores and processes NetFlow, IPFIX and SNMP data to give deep insights into the data patterns
- Based on a distributed database architecture for the best scalability
- Facilitates efficient network capacity planning
- Helps to develop QoS strategies
- Recognizes vulnerabilities and viruses early
- Possible to monitor data from various sources using a single threshold definition
- Single server setup that is perfect in situations where a single analyzer handles the overall network load
Why do we recommend it?
IsarFlow stands out primarily for its GUI-based personalized reporting tool, providing individualized data views tailored to each user. Furthermore, its capabilities to recognize vulnerabilities early, efficiently plan network capacities, and manage data across multiple sources with a singular threshold definition positions it as a significant asset for network monitoring.
Who is it recommended for?
IsarFlow is apt for teams where individuals require tailored insights, or for organizations that prioritize detailed data pattern analysis, network capacity planning, and QoS strategy development. Its distributed database architecture also make it suitable for businesses that are focused on scalability and a unified approach to handling vast network loads.
Pros:
- In-depth insights into the data patterns by collecting, storing, and processing NetFlow, IPFIX, and SNMP information
- Efficiently plans the bandwidth of a network
- Aids in developing QoS strategies
- Monitors data from multiple sources using a single threshold specification
- Built on a distributed database design for better scalability
Cons:
- Not suitable for large enterprises
Contact the sales team for pricing.
7. FlowViewer
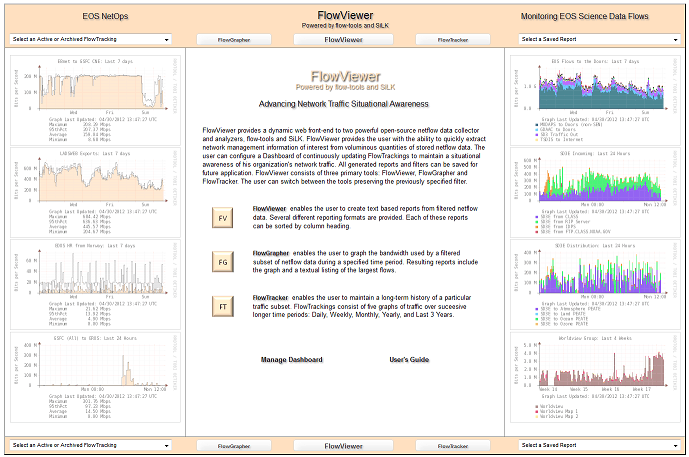
FlowViewer is a dynamic and web-based front end for two open-source data collectors and analyzers; Flow-tools suite from Mark Fullmer and SiLK from the Carnegie Mellon NetSA group. This tool was originally developed for NASA’s Earth Sciences Data and Information System Network, but it is also used extensively by users of SiLK and Flow tools.
Key Features:
- Create text-based reports from network data
- Many different reporting formats are available to suit the preferences of different users
- Graph-based reports with textual explanation
- Maintains the long-term history of a particular traffic subset. Users can choose from daily, weekly, monthly, yearly and three years option
- Allows the use of both Flow-tools and SiLK simultaneously
Why do we recommend it?
FlowViewer shines with its capability to interface seamlessly with both Flow-tools and SiLK, providing diverse text-based and graphical report formats. Originally built for a demanding environment like NASA, its flexibility in retaining long-term traffic histories and catering to varying user preferences makes it an excellent tool for comprehensive network data analysis.
Who is it recommended for?
FlowViewer is ideal for organizations and professionals who rely on Flow-tools and SiLK for network data analytics. With its emphasis on varied reporting formats and extended traffic history retention, it’s suitable for those requiring a detailed yet flexible overview of their network activities over time.
Pros:
- Uses network data to generate text-based reports
- Choose from different supported reporting formats for various users
- Creates reports with graphs and written explanations
- View the extensive records of a specific traffic subset stored in the system
- Permits the use of SiLK and Flow-tools at the same time
Cons:
- Has fewer advanced reporting and filtering features
This is an open-source tool that’s available for free.
Conclusion
To conclude, IPIX collectors and analyzers give abundant information about a network’s health and performance. These IPFIX tools collect information from network packets, allowing you to correlate them and give the information you need in a concise form.
We highly recommend giving them a download and testing in your environment – every software package from above has different feature and capabilities as well as price points.

