Networks and its immediate surroundings are a busy place – Bandwidth battles for resource hungry applications, security threats and the need for constant up-time means you’ll have to stay on top of your network’s performance, security and reliability all the time. This is not always easy to stay on top of.
The good news is IP Monitoring Software and tools greatly ease your job of monitoring and managing your critical resources. These tools review, analyze and manage network traffic, interfaces and applications seamlessly, and through such analysis they give you in-depth reports on Network & Application Performance.
Here is our list of the best IP monitor software for managing and monitoring servers.
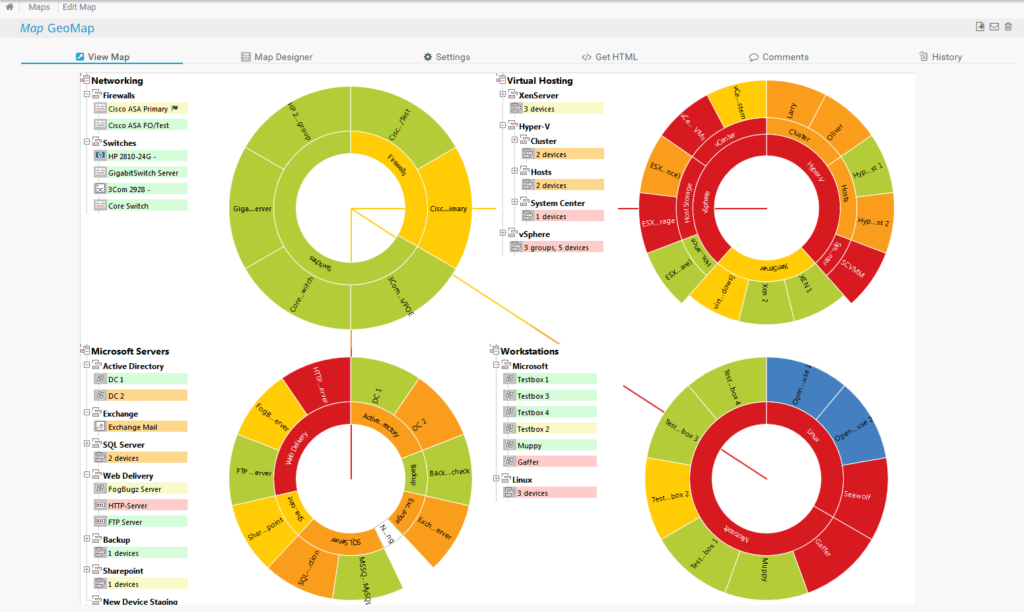
- Paessler PRTG – FREE TRIAL A group of monitoring tools that cover networks, servers, and applications. Sensors include an IP ping sweep tool for device discovery and network mapping. Installs on Windows Server. Start a 30-day free trial.
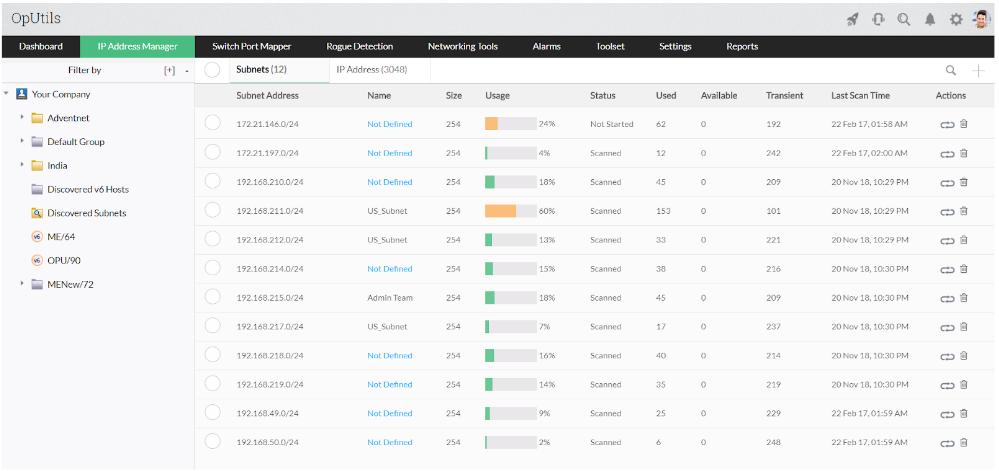
- ManageEngine OpUtils – FREE TRIAL An IP address manager coupled with a switch port mapper and a port scanner. Installs on Windows Server and Linux. Get the 30-day free trial.
- Site24x7 Network Monitoring – FREE TRIAL A SaaS package that provides network statistics gathering for traffic analysis and also provides support for traffic shaping. Access the 30-day free trial.
- PowerAdmin A network and server monitor that includes a device discovery module. This tool lists devices by IP address and monitors their performance. Installs on Windows and Windows Server.
- Icinga A free system monitor that is able to accept Nagios plugins and includes IP monitoring features. Installs on Linux.
- Nagios Available in a free version called Nagios Core and a paid version called Nagios XI, this system monitoring tool has a large library of plugins available to extend its capabilities. Installs on Linux.
- Zabbix A system monitor similar to Nagios, this tool can be installed on Linux servers or cloud hosting services for free.
- Pandora FMS A system monitor with IP management and monitoring modules. Available in free and paid versions for Linux.
- OpenNMS An open source system monitoring platform with IP management capabilities. Available in free and paid versions for Linux.
On top of those, other reasons to use IP monitoring software and tools include some of the following:
- Gives internal network visibility for system monitoring
- Identifies the slow and bandwidth-hungry applications, so you can plan better for future growth and procurement of new devices.
- Detects spyware, ransomware and other malware attacks before they compromise your network and critical resources before they become a problem (think Ransomware detection).
- Detects the outflow of personal information to clients. This is particularly important if your organization is in the financial world.
- Helps with capacity planning.
The above list clearly shows that you need a comprehensive and reliable tool for monitoring your network.
The Best IP Monitor Software/Tools
Below you’ll find a list of the Best IP monitor software and tools that can help you accomplish all of the above tasks and many more. These tools are highly rated by users and come with comprehensive features to make IP monitoring a thorough and automatic process. Some are FREE and Others have 30 Day Trials and have comprehensive Support thereafter.
Let’s take an in-depth look into each of these tools and how they can help you monitor IP Networks and Servers:
1. Paessler PRTG – FREE TRIAL
PRTG is an all-in-one monitoring tool from Paessler, a German company that has been specializing in manufacturing a wide range of network and device scanners since 1997.
Key Features
Here is a list of features available in PRTG:
- A central dashboard gives you a bird’s eye view of your network’s performance.
- You get instant notifications if any metric goes below the pre-determined threshold limit.
- PRTG pings all available IP addresses in your network and automatically begins to monitor the devices associated with these IP addresses.
- Comes with more than 200 pre-configured sensors that monitor different metrics.
- Easy to set up and starts monitoring right away.
- Saves time, effort and money.
- Compatible with all mobile devices
- Comes with an API for easy customizing.
Why do we recommend it?
PRTG stands out as an all-encompassing monitoring tool, providing immediate notifications if metrics drop below set thresholds, and it’s equipped with over 200 pre-configured sensors for diverse metrics. Its ease of setup and ability to immediately begin monitoring, combined with its capability to give a holistic view of the network’s performance, make it a top pick.
Who is it recommended for?
Paessler PRTG is suitable for IT professionals and businesses aiming for a comprehensive view of their network’s health and performance. It’s ideal for those who appreciate quick setup and out-of-the-box monitoring capabilities, and for teams looking for a tool that can seamlessly integrate with mobile devices. Additionally, organizations that prefer customizable solutions through APIs will find PRTG beneficial.
Pros:
- Easy to monitor and manage the entire IT infrastructure
- Helps track network traffic usage
- Easy to setup and supports all mobile devices
- Helps identify potential issues in real-time
- Generates detailed insights into network performance
Cons:
- Paessler PRTG provides a number of features that could take some time to comprehend.
Pricing: The pricing model of PRTG works slightly differently when compared to other products. Here, the pricing depends on the number of sensors you add.
The pricing structure for sensors are as follows.
- 100 sensors or less – Free
- 101 to 500 sensors – $1600
- 501 to 1000 sensors – $2850
- 1001 to 2500 sensors – $5950
- 2501 to 5000 sensors – $10500
If you want unlimited sensors, choose from the following two plans.
- XL1 Unlimited – Any number of sensors on one core server installation. Cost is $14,500
- XL5 Unlimited – Any number of sensors on five core server installations. Cost is $60,000
The above cost includes one year maintenance. To renew, pay 25% of the cost of the license. You can use up to 100 sensors for free. If you need to deploy more sensors on your network, you can take advantage of this 30-day free trial.
Download: https://www.paessler.com/download/prtg-download
2. ManageEngine OpUtils – FREE TRIAL
ManageEngine OpUtils is a system that takes care of all addressing matters on a network. This includes the detection, logging, and management of IP address usage, MAC address location, and port number access.
Key Features
OpUtils offers the following features:
- Scans a system to identify all IP addresses in use
- Interacts with a DHCP server to update address availability records
- Provides a Wake on LAN function to enable monitoring of devices that are turned off
- Detects rogue devices connected to the network-m
- Supports subnet planning
- Identifies subnet address conflict issues
- Logs IP address allocations
- Maps switch port usage
- Identifies equipment by IP address and MAC address
- Allows traffic monitoring to be segmented per endpoint and per applications
- Includes a TCP/UDP port scanner
- Identifies security weaknesses caused by open ports
- An SNMP checker to ensure that SNMP device agents are working
- A Ping utility to report on response times
- A TFTP server
- A config file manager for network devices
- Access from mobile devices through an app for iOS and Android
- System alerts that are triggered when performance thresholds are breached
- Problem notification by SMS and email
Why do we recommend it?
ManageEngine OpUtils is a comprehensive solution for addressing and managing all network-related matters, from IP address usage to port conflicts. Its capabilities span from scanning systems to identify active IP addresses, supporting subnet planning, to providing crucial security insights such as open port weaknesses. Its versatility and options like problem notifications via SMS and email make it a robust tool for any network management needs.
Who is it recommended for?
ManageEngine OpUtils is tailored for IT professionals and businesses that seek a detailed and proactive approach to network management, especially those prioritizing IP and MAC address management. It’s also ideal for organizations that want insights on potential security vulnerabilities and desire mobile access through iOS and Android applications. Moreover, teams needing a web-based tool accessible from various locations will find OpUtils exceptionally beneficial.
Pros:
- Access the web-based tool from any location
- Uses Ping utility to update response times
- Helps discover active IP addresses by running regular scans
- Users can export reports in different file formats
- Quickly detects issues and security weaknesses that occur due to open ports
Cons:
- Most home users find ManageEngine OpUtils quite challenging
Pricing: ManageEngine is available in two editions. The Standard edition is free to use. However, the important tools in the suite, such as the IP address manager and the switch port mapper are only available in the paid version, which is called Professional.
Download: Both versions are available for Windows Server and Linux. You can download a 30-day free trial of the Professional edition at manageengine.com/products/oputils/download.html
3. Site24x7 Network Monitoring – FREE TRIAL
Site24x7 Network Monitoring is a cloud-based service that forms part of a full stack monitoring SaaS package.
Key Features
The important features of the Site24x7 Network Monitoring system are:
- Uses SNMP to identify network devices
- Creates a network inventory and keeps it up to date
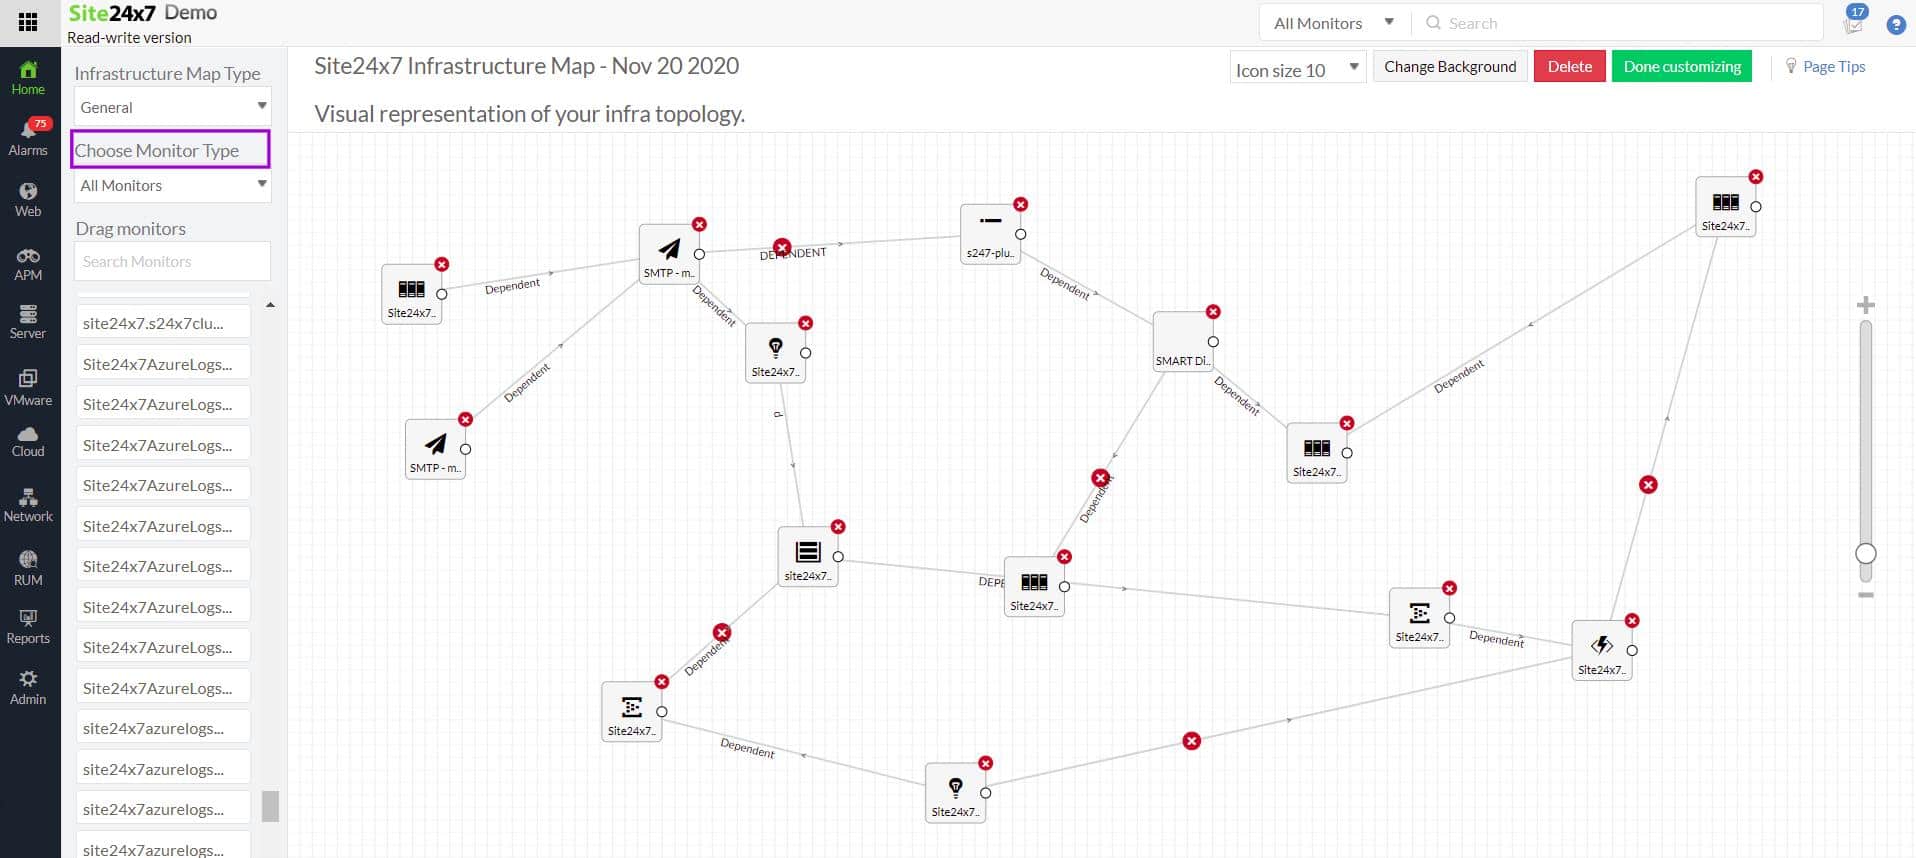
- Automatically draws a network topology map
- Constant drive health monitoring with SNMP
- Alerts for device problems, performance dips, or resource shortages
- NetFlow, sFlow, J-Flow, CFlow, IPFIX, AppFlow, and NetStream
- VoIP quality of service metrics
- Provides IP SLA and MOS metrics
- Full stack monitoring
- Network configuration management
- Device configuration backup
- Configuration tampering reversal option
- Firewall monitoring
- Cloud infrastructure monitoring
- WAN connection monitoring
- Ping connection tester
- Signal strength and data transfer rate monitoring for wireless networks
- VPN monitoring
- Load balancer monitoring
- IoT device monitoring
- WAN accelerator monitoring
Why do we recommend it?
Site24x7 Network Monitoring offers a comprehensive cloud-based solution covering many network monitoring needs, from creating an updated network inventory to sophisticated features like VoIP quality metrics and firewall monitoring. It not only allows for detailed monitoring but also ensures the health and security of devices with features like configuration tampering reversal.
Pricing: Site24x7 provides subscription plans that include combinations of modules. Such as the Infrastructure plan, which includes network device, traffic, server, application monitoring plus log management, and network configuration management. This package starts at $9 per month.
System requirements:
Site24x7 is a cloud-based package.
The full package of a Site24x7 subscription also gives you server and application monitoring and there are plans that include log management or website monitoring. You can try any Site24x7 plan with a 30-day free trial.
Who is it recommended for?
Site24x7 is ideal for businesses and IT professionals who are in search of a cloud-based, full-stack monitoring solution. Given its wide range of features, it’s particularly suited for those who require an all-in-one network monitoring package, including capabilities like IoT device, VPN, and WAN accelerator monitoring.
Pros:
- Network capacity planning support
- Alerts for performance problems
- Root cause analysis
Cons:
- No system management functions
Download: https://www.site24x7.com/signup.html?pack=44&l=en
4. PowerAdmin
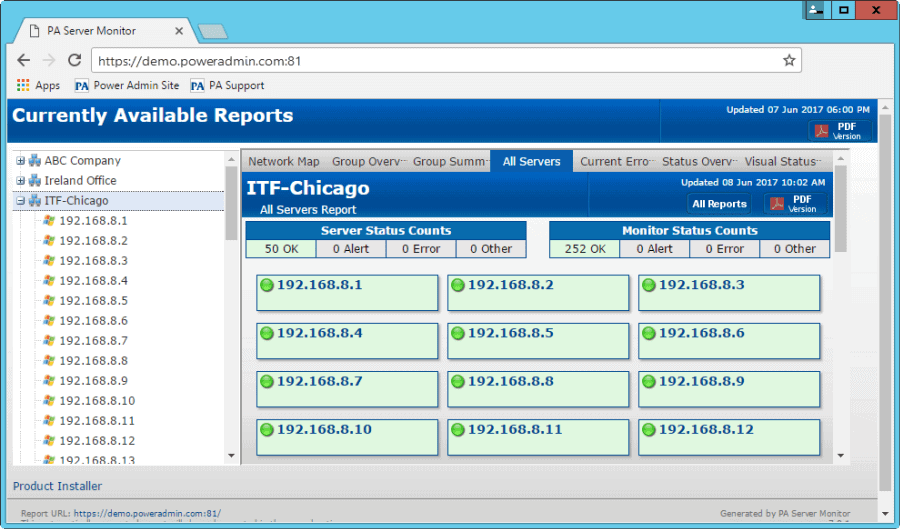
Power Admin is a powerful network and server monitoring software that reports the performance and availability of devices in your network.
Key Features
The features of Power Admin are listed below:
- Securely monitors remote and local servers.
- Gives a complete view of your disks.
- Provides proactive warnings, so you can fix problems before they get out of hand.
- You can view reports anytime and from anywhere
- Monitors all Windows performance counters and SNMP objects
- Configuration is quick and simple. No scripts or configuration files are required.
- Helps you to know the status of your network at all times.
- Comes with a neat interface for mobile devices.
- Application console is simple to use and intuitive for the most part.
- Provides agentless monitoring from a service
- Monitors both Linux and Windows devices.
- Safely sends data to remote networks using SNAP tunnels
- Automates common IT tasks through the Action Scheduler module.
- Monitors login and other security related activities in Active Directory
- Measures different parameters such as bandwidth, network error counts and broadcasts
- Database Monitor modules watches activities on database including the transaction log size.
- Sends alerts if there are any deviations from the established “normal”
- Email Monitor module monitors email messages in POP3 and IMAP4 mailboxes
- Event Validator Monitor module checks if certain events are completed successfully. Some examples of events include backup, updation of anti-virus pattern file and so on. Sends alerts if any of these tasks have failed.
- You can execute custom scripts written in Visual Basic programming language.
- Constantly monitors the ages of files and alerts if they get too old.
Why do we recommend it?
Power Admin is a versatile monitoring tool, providing insights not only on performance but also on security-related activities within the network. Its proactive warning system ensures problems are addressed before they escalate. The ease of configuration, combined with its agentless monitoring and capability to track both Linux and Windows devices, makes it a standout solution.
Who is it recommended for?
Power Admin is best suited for IT professionals and businesses seeking an extensive and user-friendly monitoring solution for their network. It’s especially beneficial for those who require real-time insights on various network parameters, proactive alerts for system deviations, and flexibility in task automation.
Pros:
- Provides detailed insights on the performance and availability of network devices
- PowerAdmin is compatible with both Linux and Windows devices
- Custom scripts can be easily executed.
- Uses Action Scheduler module to automate common IT tasks
- Track network error, bandwidth as well as broadcasts
Cons:
- PowerAdmin does not support Linux operating systems.
- It does include options for setting up bulk settings for numerous devices.
Pricing: Power Admin offers many editions and pricing options.
If you opt for subscription-based pricing, your are charged on a per monitored device basis. The cost on a monthly basis is,
- 1 to 9 devices – $6 each
- 10 to1 9 devices – $3.6 each
- 20 to 49 devices – $2.88 each
- 50 to 99 devices – $2.10 each
- 100 to 249 devices – $1.32 each
- 250 to 499 devices – $0.72 each
- 500 to 24999 devices – $0.54 each
- 2500+ – Contact the sales team
You can also choose to buy a one-time perpetual license. The pricing of this license is
- $125 for Ultra edition
- $49 for Lite version
- $99 for Pro version
- Contact the sales team at https://www.poweradmin.com/contact-us/?f=p for corporate edition.
System requirements:
The following things should be present in your system to install and run Power Admin
- Windows operating systems XP, 7,8,8.1 and 10.
- Windows Server: 2003, 2008, 2008 R2, 2012, 2012 R2 and 2016.
- Supports both 32 bit and 64 bit operating systems.
- Internet Explorer 9 or higher
- .NET 2.0 for higher for generating reports
- 50 to 500 MB of free physical RAM for monitoring.
- 50MB to 50GB of disk space, depending on what is being monitored.
Download: You can download a trial version from https://www.poweradmin.com/products/server-monitoring/downloads/
No sign up or credit card is required and all the features are available for a limited period of 30 days.
5. Icinga
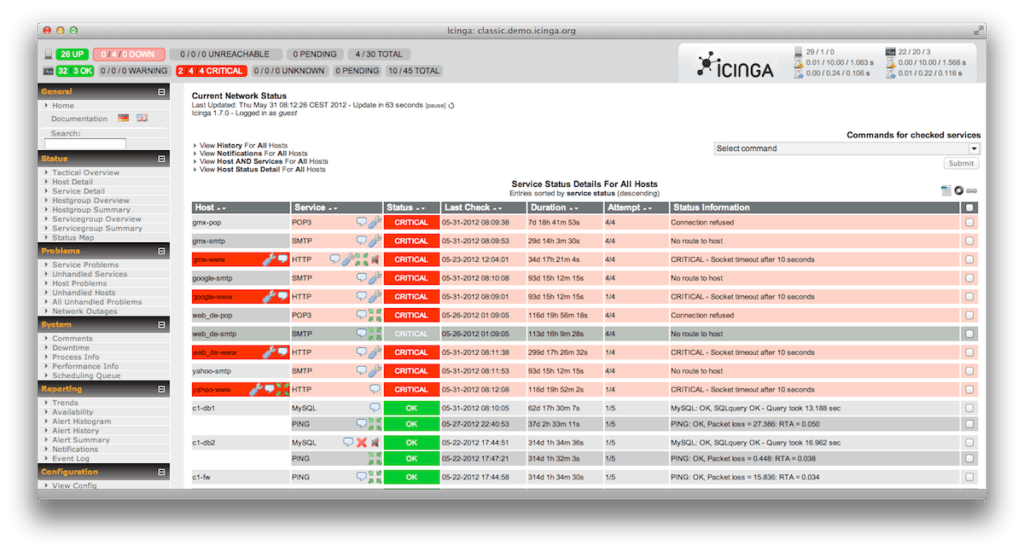
Icinga is an open-source network monitoring application that was originally created as a fork of the popular Nagios application. The idea behind creating Icinga was to rectify the shortcomings in Nagios and to add new features to keep pace with changes in IT design and development.
Key Features
Icinga comes with many interesting features, and they are:
- Supports three different types of logging, namely, file logging, syslog on LINUX/UNIX and console logging. You can enable additional loggers as well.
- Icinga Data Output (IDO) feature exports all configuration and status information into a database.
- Icinga offers the complete set of Nagios’ features
- It maintains plug-in and configuration compatibility with Nagios, so migration between the two is simple and easy.
- Monitors network services such as SMPTP, NNTP, HTTP and POP3, host resources such as disk usage and CPU load, and server components such as switches, routers and sensors.
- Offers a simple plug-in design to help you develop your own service checks.
- Provides parallelized service checks
- Defines network host hierarchy through parent hosts.
- Detects and distinguishes between hosts that are down and those that are not reachable.
- Defines event handlers that can be run during service.
- Notifies the right contact person through many notification methods such as emails, instant message and even through user-defined methods.
- Escalates alerts to other users or communication channels when needed.
- Two user interfaces – Icinga Classic UI and Icinga Web, gives you comprehensive information about the availability and performance of different devices.
- Its reporting module is based on Jasper Reports.
- Gives extensive information to help you with capacity planning.
- Provides performance graphing with the help of add-ons.
- Ideal for infrastructure of all sizes
- Integrates with many popular DevOps tools
Why do we recommend it?
What sets Icinga apart is its comprehensive feature set, supporting various logging methods, data export to databases through IDO, and maintaining compatibility with Nagios configurations. It excels in monitoring a wide array of network services, host resources, and server components, offering scalability and flexibility.
Who is it recommended for?
Icinga is an ideal choice for IT professionals and organizations seeking a robust network monitoring solution. It caters to those monitoring diverse network services, host resources, and server components, making it adaptable for various infrastructure sizes. Its compatibility with Nagios eases migration, especially for Nagios users.
Pros:
- Supports integration with major DevOps tools
- It provides a comprehensive view of the entire network and its performance
- The advanced features help identify and address any potential issues
- Export all configuration and status data into a database
- Supports Syslog on LINUX/UNIX, file, and console logging
Cons:
- The monitoring solution does not support generating PHB graphs
- Configuration can be challenging for some users
Pricing: 100% Free
Download: Download Icings from https://www.icinga.com/download/
6. Nagios
Nagios is a core monitoring engine that comes with a simple interface. Many products have been built on this core engine, and the most notable among them are Nagios XI, Nagios Log Server, Nagios Fusion and Nagios Network Analyzer
Key Features
Nagios comes with the following features:
- Monitors the network for problems caused due to a wide range of factors including overloaded data links and network connections.
- Supports both agent-based and agentless monitoring.
- There are more than 5000 different add-ons available for Nagios.
- Quickly detects applications, services or process problems.
- Greatly reduces the chances of downtime
- Provides tools for monitoring not just the application, but also its state.
- Monitors availability, uptime and response time of every node in the network.
Why do we recommend it?
Nagios excels in swiftly detecting issues with applications, services, or processes, significantly reducing the risk of downtime. It not only monitors the availability but also the state of applications and nodes across the network.
Who is it recommended for?
Nagios is recommended for IT professionals and organizations seeking a robust and adaptable network monitoring solution. It’s particularly suited for those who need to monitor diverse factors contributing to network problems and require a range of monitoring options, including agent-based and agentless approaches.
Pros:
- Integration of apps from third parties is made simple by the use of APIs
- Easy to monitor new services, apps, or devices.
- Nagios provides 5000+ different add-ons
- Helps minimize downtime
- Helps users track the uptime and response time of every network node.
Cons:
- Installing plug-ins can be a challenge at first.
- False positive alarms can be challenging to locate and eliminate.
Pricing: Nagios core engine is free. But you’ll have to pay a subscription fee for the products built on it such as Nagios XI and Nagios Log Server.
Download: Download Nagios from https://www.nagios.org/downloads/nagios-core/
7. Zabbix
Zabbix is an enterprise class monitoring platform that provides in-depth information about the performance of all devices on your network.
Features
The features of Zabbix are listed below:
- Collects metrics from any device, system or application.
- A native Zabbix agent runs on different platforms such as Windows, UNIX and Linux to collect data such as CPU, memory, disk space and more.
- Supports SNMP and IPMI agents.
- Executes custom scripts. This helps to extend the functionality of Zabbix as you can create scripts in Perl, Python and Ruby.
- Calculates and aggregates different values to give you a comprehensive picture.
- Its web module can execute pre-defined scenarios and store the results. This feature can be particularly useful for web monitoring.
- Automatically detects problem states within the incoming flow of data. A separate analysis is not required.
- Predictive functions help to predict the possibility of a problem, so you can fix the cause even before the problem occurs.
- Provides flexible and intelligent threshold options
- Uses information obtained from different devices to build a trigger expression.
- Provides historical analysis
- Identifies multi-level dependencies
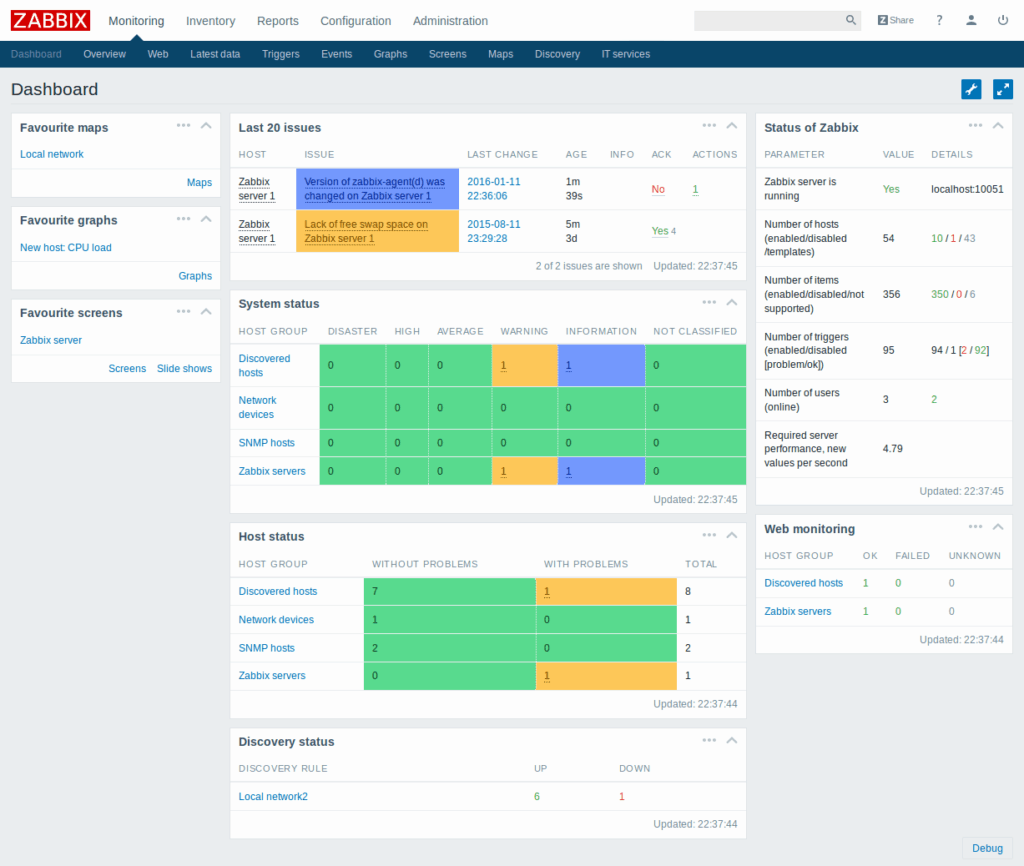
- Supports six trigger classifications, namely, disaster, high, average, warning, information and not classified.
- Comes with a widget-based dashboard that gives you the flexibility to choose the information you want to see.
- Displays graphs, network maps, slideshows and drill-down reports.
- User interface is simple and powerful. It is a one-stop place to get all the information you want.
- You can choose to allow Zabbix to fix issues automatically.
- Choice to escalate problems based on user-defined service levels.
- Messages are customized based on recipient’s role and available information.
- Strong encryption between different Zabbix components
- Supports multiple authentication methods, namely, LDAP and Active Directory
- Comes with a flexible user permission schema
- Code is open for security audits.
- Installs within minutes
- Out-of-the-box templates are available for popular platforms
- Supports custom templates, over and above the hundreds of templates built by the Zabbix community.
- Periodically scans and discovers devices.
- Automatically creates triggers, items and graphs for different elements on a device.
- Starts monitoring new equipment automatically without any prompt from user.
- Ability to collect data from thousands of monitored devices.
- Monitors even behind firewalls and DMZs
- Can run custom scripts on monitored hosts remotely
- Highly scalable for any IT environment
- Integrates well with many third-party software.
Why do we recommend it?
Zabbix excels in predictive analysis, automatically detecting problem states without needing separate analysis. Its flexible threshold options, trigger expressions, and support for various authentication methods make it highly adaptable to diverse network environments.
Who is it recommended for?
Zabbix’s ability to automatically detect and predict problems, coupled with its historical analysis capabilities, makes it ideal for organizations that prioritize proactive issue resolution and outage prevention. Additionally, its scalability, support for custom templates, and integration with third-party software make it suitable for complex network environments.
Pros:
- It can be used for basic monitoring to complex event processing
- Creates a trigger expression using data collected from different devices.
- Flexible and provides a historical analysis
- Save and execute pre-defined scenarios
- Quickly detect and fix problems as well as prevent outages
Cons:
- UI/UX requires improvement
- More templates from Zabbix are required for detailed monitoring.
Pricing: Open-source and 100% free to use.
Download: You can download Zabbix from https://www.zabbix.com/download
8. Pandora FMS
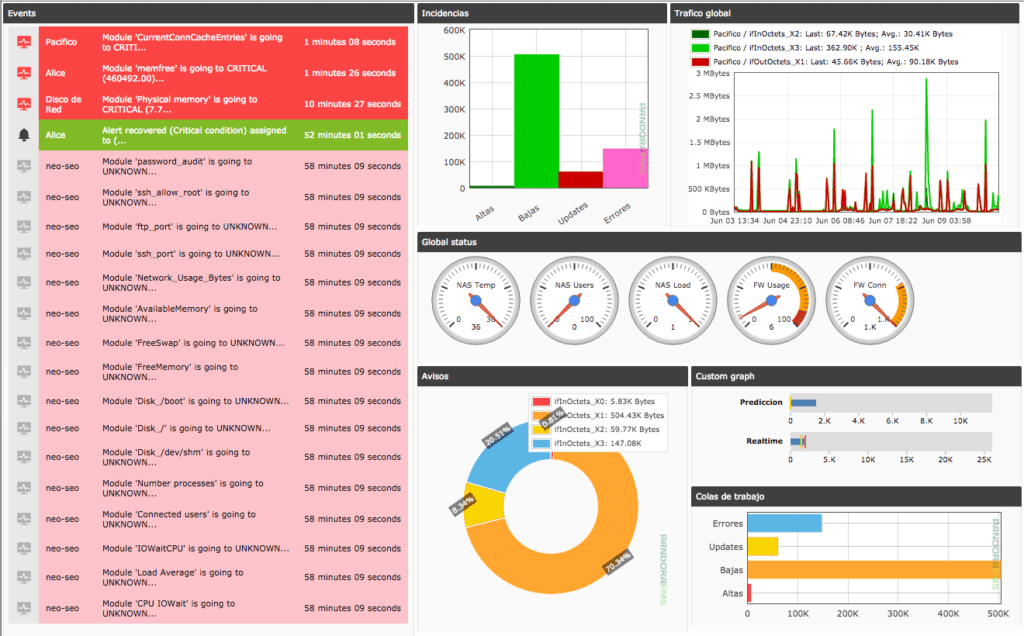
Pandora FMS is a complete open-source monitoring solution that gives comprehensive information about network equipment, servers and different kinds of applications.
Key Features
Pandora FMS has the following features:
- Monitors performance and availability of different devices and applications.
- Has an event-based management architecture.
- Supports virtual infrastructure and cloud computing
- Has an API for SSO
- Visual console is highly customizable
- Supports Geolocation, CLI management and LDAP authentication
- Supports up to 1000 agents in the OpenSource version and 2,000 agents in the Enterprise edition.
- Has an API library for third-party integration
- Multi-platform agents are available for Windows, Linux, HP-UX, Solaris and BSD.
- Provides support for many plug-ins in the Enterprise edition.
- Role-based access control levels are supported.
- Comes with a light web console for mobile devices
- Reports can be scheduled in the Enterprise edition
- A customizable and intuitive dashboard is available in the Enterprise edition.
- Supports IPAM, SSH, SNMP, IPv6, WMI and Netflow.
Why do we recommend it?
Pandora FMS stands out for its event-based management architecture and support for virtual infrastructure and cloud computing. With a highly customizable visual console, Geolocation, LDAP authentication, and multi-platform agent support, Pandora FMS offers adaptability and scalability.
Who is it recommended for?
Pandora FMS is recommended for IT teams and organizations seeking a versatile and customizable monitoring solution. It’s particularly suited for those who require real-time monitoring of a wide range of devices and applications, including those in virtual and cloud environments.
Pros:
- Helps IT teams to monitor their network and systems in real-time
- The intuitive user interface helps quickly identify and troubleshoot problems.
- It is highly scalable and can be used to monitor a wide range of devices from different vendors.
- Users can customize the monitoring experience according to their needs
- Users can use the software without any prior experience or technical knowledge.
Cons:
- Expensive
- Sometimes the older version’s UI crashes.
Pricing: The Open source version is free, but you have to pay a fee for the Enterprise edition. Contact the sales team to get a quote for the Enterprise edition.
Download: You can download the open source edition from https://pandorafms.org/en/features/free-download-monitoring-software/
9. OpenNMS
OpenNMS is an open-source platform designed for building a wide range of network monitoring solutions. There are two distributions in OpenNMS, and they are: Meridian and Horizon.
While Meridian is ideal for businesses that need stability and long-term support, Horizon is where innovation happens quickly thereby making it ideal for monitoring new technologies and IT ecosystems.
Key Features
The features of OpenNMS are:
- Isolates problems for meaningful reporting
- Polling intervals change automatically, depending on events such as outages.
- Gathers information from outside sources too such as vulnerability information from Nessus tailed log files.
- Comes with SNMP hooks
- Handles a wide variety of complex management tasks
- Uses event-based architecture for alerts and notifications
- Sends alerts through many channels such as email, Slack, MatterMost, Jabber, XMPP, microblog notifications, external scripts and APIs.
Why do we recommend it?
OpenNMS is a versatile open-source platform designed to cater to a wide range of network monitoring needs. It offers two distributions, Meridian and Horizon, catering to different organizational requirements, making it a flexible IP monitoring solution.
Who is it recommended for?
OpenNMS is particularly beneficial for organizations requiring event-based alerting and notification systems, with support for multiple communication channels.
Pros:
- Monitor application and service availability
- Identifies latency issues
- Tracks service response time
- Generates alarms for critical services
- Helps save user’s time and resources
Cons:
- Weak MIB management
- Delayed alerting
Pricing: Horizon edition is free while Meridian comes with a yearly subscription fee.
Download: You can download the Horizon edition from https://www.opennms.org/en/install
Conclusion
To conclude, IP Monitoring Tools and software are essential to protect your company’s valuable resources and to alert if something is wrong with any Device, Service or Application in your network infrastructure.
The tools discussed above are comprehensive and will give you all the information you need to stay on top of everything that is happening in your network at anytime of the day or night. In addition, it saves time, money and effort for you as an organization by minimizing downtime and really ensuring that all critical production systems are up at the most important hours of the day/night.

