Today, in order to stay ahead of your competitors, it is essential to keep track of repeated measurements over time. Time is a crucial data variable in time series analysis. Analysis of the Times series aids in our study of the world and our growth within it. For example, it briefs on how your inventory was sold one day and the next. It helps compare data over time and discover the cause for changing patterns.
Using the time series data, you can discover the underlying causes of trends and track the changing patterns over time. Further, it helps identify outliers in the data and predict the future.
With the increase in application use, sensors and systems, it has become difficult for organizations to track each data manually over time. Thus, to monitor their systems organically, precise tooling is crucial for each business. If your business fails to keep track of the cause behind downtime or degraded user experience, chances are high that the dissatisfied customers will switch to other applications or platforms instantly.
Hence, to deliver a better user experience and measure systemic patterns over time, businesses must invest in monitoring tools that help analyze data over consistent intervals. Graphite Monitoring is one popular tool that helps collect and analyze infrastructure, application, and business metrics. It displays data in a time-series format and prepares graphs for better understanding.
It is a highly scalable platform that DevOps can use for improving performance and reducing MTTR and MTTD. As a result, businesses will be able to boost their productivity and ROI.
Here, in this Beginner’s Guide, we will discuss the Graphite Monitoring tool in detail – its features, benefits, and role.
What is Graphite Monitoring?
Graphite is an open-source monitoring tool used by many organizations to track and graph time-series data. It enables team members to plot data from a number of sources and on a massive scale. It is a free, next-generation monitoring tool that is capable of holding, querying, and visualizing time-series data collected from anywhere, whether it is servers, devices, systems, or websites, all at once.
In 2006, Chris Davis at Orbitz designed and developed the leading monitoring tool, which was later in 2008, released under the open-source Apache 2.0 license. The graphite monitoring tool is quite flexible and can be easily configured for monitoring data over time. You can track the CPU usage and hard disk performance in graphical form using this tool. Also, it helps businesses process various activities, such as throughput rates and temperature reports.
Additionally, the monitoring solution provides full visibility and allows your employees to track the behavior and patterns of each system and application. It further aids in detecting errors and leads to continuous improvement. With Graphite, businesses can also store, monitor, and visualize data without any hassle. Further, it also helps trigger alerts for particular events.
It collects metrics and graphs the observations taken sequentially in time to display trends and patterns. The collected time series data is then used for analysis and predicting future events. Using this information, businesses can also predict capacity shortfalls and align strategies to manage risks.
Graphite uses Carbon and Whisper techniques to understand the underlying time-series data and its components. We will discuss both these techniques in detail later. For now, let us stick to Graphite and its use.
Graphite provides the GitHub Engineering and Operations teams with the tools needed to gather and correlate large amounts of time-series data. It offers an API that allows app developers, systems administrators, network engineers, and other security engineers to hold on to time-series data as needed. Graphite is one of the trusted open-source monitoring tools used for time-series data storage and visualization. You can find many similar tools online that aid in monitoring time-series data, but what makes Graphite unique is its excellent features.
Graphite is a simple tool used by organizations for recording data and plotting it. Also, it has broad applications beyond just monitoring, which helps large companies such as GitHub analyze massive amounts of time-series data, anomaly detection, trend analysis, etc.
Etsy, GitHub, Simple, Reddit, Booking.com, Hive Streaming, and EA Games are some of the leading companies that use Graphite to track the performance of servers, websites, and applications.
If your DevOps are demanding a monitoring software that helps them visualize the data in time-series data format, we recommend Graphite over other tools available online.
Features
Users can easily push metrics to Graphite from different scripts and command line terminals. Also, it has a simple interface and excellent features that make it a unique option. Let us have a look at some of its advanced features:
- Simple Metrics Format One of the best attributes of this monitoring solution is it has a simple metrics format requiring only the dot-delimited metric name, an epoch timestamp, and a numeric value for data submission to the Carbon listener. It will hardly take any time for the user to send telemetry using the simple format and shortcodes.
- Statistical Library Unlike other monitoring tools, Graphite has an extensive library of statistical and transformative rendering functions that use API to perform computations on time-series data. It also offers primitives that further aid in classifying the minimum, maximum, and mean of a series. Additionally, users can calculate the percentiles for each series. If you think that these many features are enough to convince you, let me tell you there is more. Graphite also supports Holt-Winters forecasting algorithms and allows users to sort and filter each criteria virtually.
- Rapid Prototyping What makes Graphite unique is its beautiful web interface and the composer. It helps users easily navigate metrics and take snapshots of graphs. Also, you can conveniently add or remove metrics from the graphs using the tool. Also, it helps expose rendering APIs and apply statistical transformations. The composer on the other hand helps visualize and correlate the data. Another best part about this feature is the graph automatically gets refreshed after every step to display the new arrangement. You can also create a copy of graph URLs and share it with the team. The Graphite monitoring tool helps identify causal relationships in the best way and isolates anomalous behavior rapidly uniting other trending systems and monitoring tools.
- Graphing API Unlike other tools, in order to create a new graph, Graph does not rely on static configurations. It uses comprehensive APIs to create and compose dashboards and information graphics. Also, you can easily share the composed graphs with your team members and embed the URL in dashboards or websites.
Advantages
Today, most high-profile companies choose Graphite over other monitoring tools, the only reason is they are highly advantageous to the organizations and deliver accurate results. Let us have a look at some of the benefits of the Graphite Monitoring Solution:
- Large Community Graphite has a large and varied community for its users. Be it software engineers, system administrators, business executives, or marketers, you can find a bunch of people as part of the community.
- Free Open-source monitoring tool You can run the graphite monitoring tool free of charge on Docker containers, Unix, Linux, and Mac OS. Being open-source software, users have full access to download its source code from the GitHub repository, modify it, and use it in different environments.
- Easy-to-Use software Another benefit of the Graphite tool is it is quite easy to use and requires little technical knowledge. Rest, it is quite easy and requires users to install three main components separately – carbon, whisper, and graphite user interface.
- Automation process Graphite automates the data collection and display process. It displays all the collected information in the graphical format automatically so that you can get a better understanding of it and perform analysis faster.
- Supports different formats Graphite uses APT and a composer to select and display templates. It enables users to display templates in different formats like XML, CSV files, images, and JSON.
What does Graphite do?
Graphite monitoring solution provides full-stack visibility and works on eliminating unnecessary downtime. It keeps you posted about each part of the stack that begins to fail. Also, it enables IT administrators to collect metrics and gain in-depth insights into each server, application, and network components. Thus, helping users to understand the root cause of performance problems and make informed business decisions.
Graphite also helps save time and energy of your team by defining which system requires more attention and what metrics must be measured. This feature enables administrators to create intuitive dashboards and reports best fit for business objectives.
Graphite is a ready-to-use, infrastructure monitoring solution for enterprises that can be integrated with existing infrastructures and address issues with time-series data warehousing, performance measurements, and data visualization. It powers both the technical and the business metrics tracking in GitHub.
Although Graphite does not support Win32 monitoring natively, a third-party utility can be used to ship Windows monitor data to the Graphite server. For instance, enterprises can send data from application or system monitoring tools into Apache Spark, or another large data database, perform anomaly detection and then send this information back into a Graphite monitoring tool.
It has three main components, including Carbon, Whisper, and Graphite-web.
Carbon is the main component in the Graphite Monitoring Tool that takes metrics across a network and then writes them to a disk using Whisper, a time-series database. The Graphite monitoring tool, written in Python, averages data and stores it once a minute, or at any user-defined interval. Graphite uses a listener to listen to inbound monitoring data, which is then written to a database called Whisper.
The three components together help visualize and prepare graphs that are further used for a better understanding of the collected data.
If you are looking for a way to present a feed of time-series data, go for Graphite. Graphite is a fully integrated time-series database and monitoring solution that runs queries, visualizes, and alerts on the basis of time-series data. Another benefit of graphite is it supports multiple data integrations and third-party tools.
Using the graphite monitoring tools, you can monitor application performance and profiling data, track resource utilization and campaign results, and further correlate sales and operational expenses quarterly results. Graphite benefits are not limited to only DevOps, in fact, marketers, system administrators, engineers, and business executives can also gain good benefits from the monitoring solution.
Integrations
Graphite supports integration with existing enterprises and third-party solutions, including Netsuite, Oracle, SAP, DocuSign, Zendesk, Jira, QAD, etc. In this section we will learn how to integrate Graphite with other software tools.
Graphite has an API that allows you to send data from other applications or services into Graphite. This is often done using a “Push” API, where data is sent from another application or service into Graphite without any need for polling. A “Pull” API allows you to pull data from a Graphite aggregator into external applications or services. You can use Graphite with other tools by using the Push and Pull APIs. To use a Push API, install the required server software on your machine and configure it to push data into Graphite in real time.
Here are the top tools that can work best with the Graphite monitoring solution:
1. collectd
Collectd is a daemon that collects metrics and statistics related to system and application performance on a periodic basis. It also enables administrators to store the collected value in different formats, like RRD. It mostly runs in the background and is compatible with Linux, FreeBSD, macOS, and OpenBSD operating systems.
Another best part about this computer software is that it works great with all networking tools and applications. It also takes the support of plugins to extend its limited functionality. If you want to transfer metrics to graphite, we recommend using collectd’s write-graphite plugin.
Graphite also has features that enable it to read directly from the RRD files stored by the collectd.
You will need to edit the collectd configuration file to send metrics to Graphite dashboard.
nano /etc/collectd/collectd.conf
Uncomment the following lines:
LoadPlugin write_graphite
LoadPlugin apache
Then, scroll down the file and uncomment the Apache block and add an Instance sub-block as shown below:
<Plugin apache>
        <Instance "Graphite">
                URL "http://graphite-ip/server-status?auto"
                Server "apache"
        </Instance>
</Plugin>
Next, add the following section:
<Plugin write_graphite>
        <Node "graphite">
                Host "graphite-ip"
                Port "2003"
                Protocol "tcp"
                LogSendErrors true
                # Prefix "collectd"
                Postfix "collectd"
                StoreRates true
                AlwaysAppendDS false
                EscapeCharacter "_"
        </Node>
</Plugin>
Save and close the file then restart the Collectd to apply the changes:
systemctl restart collectd
2. Sensu Go
Sensu Observability Pipeline is another monitoring solution that can connect and transfer metrics to Graphite. It has a centralized management interface that helps users manage infrastructure complexities easily. Also, the process to transfer metrics from a new server to Graphite is quite simple. It is similar to installing and subscribing to Sensu clients.
You can use the sensu-go-graphite-handler plugin to send Sensu metrics to the Graphite.
First, install the plugin on the Sensu Go server with the following command:
sensuctl asset add fgouteroux/sensu-go-graphite-handler
Next, go to the Sensu agent machine and edit the agent configuration file to configure the annotations:
nano /etc/sensu/agent.yaml
Define annotations:
annotations:
  short_name: sensu-client
  short_dc: dc1
Next, define the Graphite handler:
{
    "api_version": "core/v2",
    "type": "Handler",
    "metadata": {
        "namespace": "default",
        "name": "graphite"
    },
    "spec": {
        "type": "pipe",
        "command": "sensu-go-graphite-handler --prefix myprefix --annotations short_dc -H my-graphite-server.test.com",
        "timeout": 10,
        "filters": [
            "has_metrics"
        ]
    }
}
Next, define the check definition:
{
    "api_version": "core/v2",
    "type": "CheckConfig",
    "metadata": {
        "namespace": "default",
        "name": "metrics-memory-vmstat"
    },
    "spec": {
        "command": "metrics-memory-vmstat.rb --scheme {{.annotations.short_name}}.vmstat",
        "subscriptions":[
            "dummy"
        ],
        "publish": true,
        "interval": 10,
        "output_metric_format": "graphite_plaintext",
        "output_metric_handlers": [
            "graphite"
        ]
    }
}
Save and close the file when you finish.
3. Grafana
Grafana is an open-source monitoring solution with excellent graph editing features and a dashboard creation interface. It also comprises a Graphite target parser that makes it easier for users to edit metrics and functions. Users can also conveniently get a larger picture of the graphical data by clicking and dragging the selection rectangle.
Follow the below steps to integrate Grafana with Graphite:
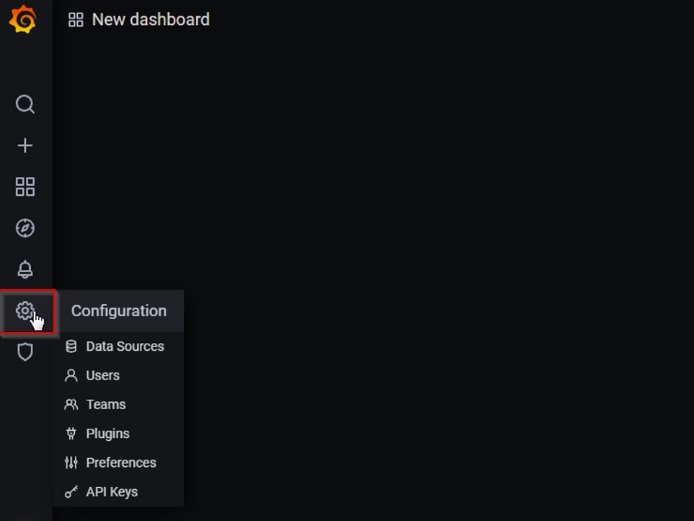
Step 1 – Open the Grafana dashboard and click on the setting icon in the left pane:
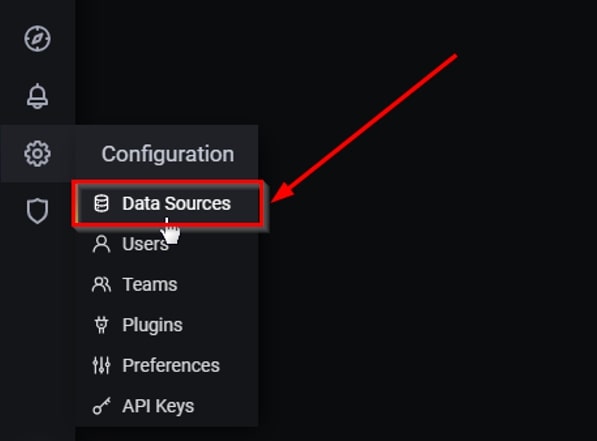
Step 2 – Click on the Data Sources from the list. You should see the Data Source search bar:
Step 3 – Click on the Add data source. You should see the list of all available data sources:
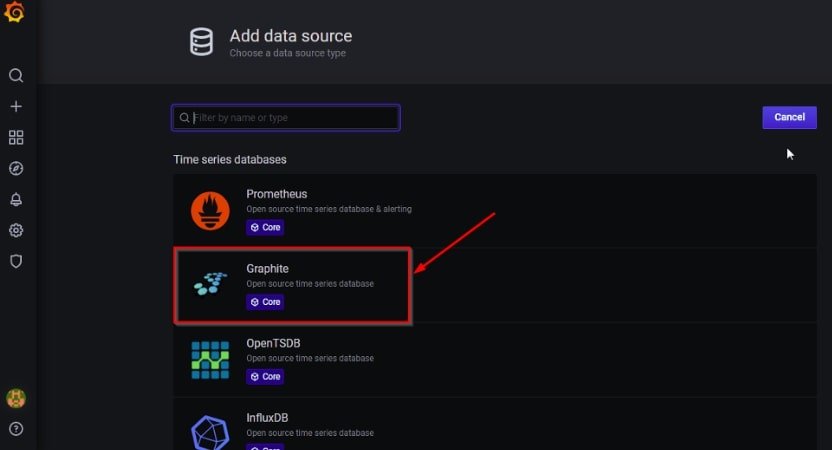
Step 4 – Click on Graphite from the list of the data source. You should see the Graphite server information page:
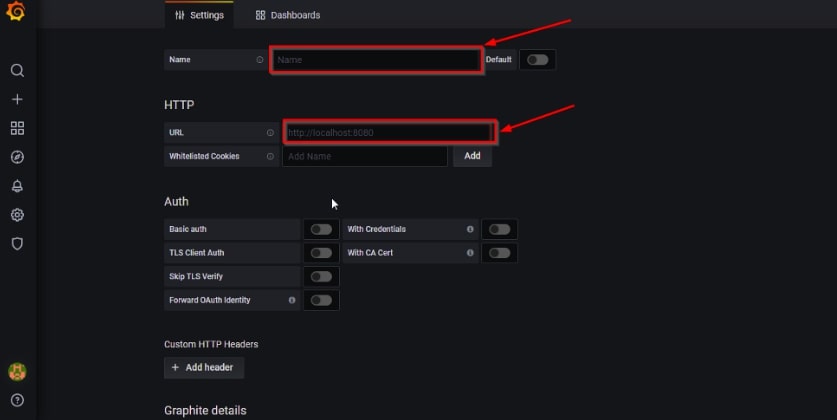
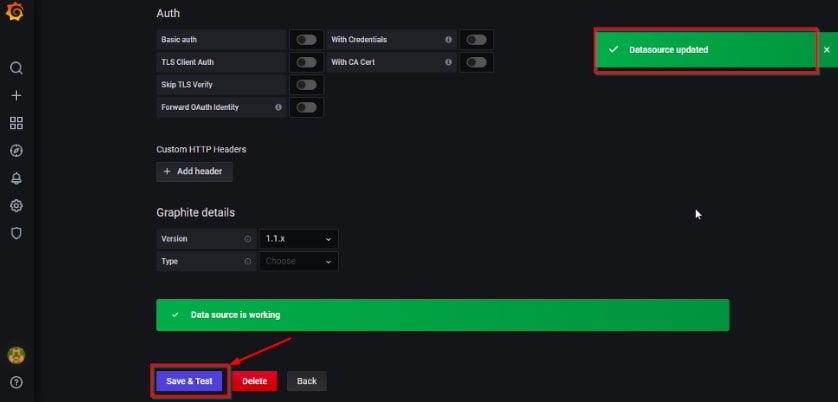
Step 5 – Define your Graphite server details and click on the Save and Test button to add the Graphite to the Grafana.
Install and Configure Graphite
First, you will need to install the Docker CE to run the Graphite container. You can install it with the following command:
apt install docker.io
Once the Docker is installed, start the Docker service with the following command:
systemctl start docker
Next, download the Graphite image with the following command:
docker pull graphiteapp/graphite-statsd
You will get the following output:
Using default tag: latest
latest: Pulling from graphiteapp/graphite-statsd
df9b9388f04a: Pull complete
b62a4c66b0bd: Pull complete
2bc1ea1acdf7: Pull complete
1e02b3e21032: Pull complete
e9120175982a: Pull complete
Digest: sha256:fb9eb6fdd8f6073dd4ff1acd2169b693d4633045017701713651befbc62fe9f5
Status: Downloaded newer image for graphiteapp/graphite-statsd:latest
docker.io/graphiteapp/graphite-statsd:latest
You can verify the downloaded image with the following command:
docker images
You should see the following output:
REPOSITORY                    TAG       IMAGE ID       CREATED       SIZE
graphiteapp/graphite-statsd   latest    cf5639253f54   6 weeks ago   850MB
Next, create required directories for Graphite:
mkdir -p /data/graphite/{data,logs,conf,statsd_config}
Next, launch the Graphite container with the following command:
docker run -d \
--name graphite \
--restart=always \
-p 80:80 \
-p 2003-2004:2003-2004 \
-p 2023-2024:2023-2024 \
-p 8125:8125/udp \
-p 8126:8126 \
-v /data/graphite/data:/opt/graphite/storage \
-v /data/graphite/conf:/opt/graphite/conf \
-v /data/graphite/statsd_config:/opt/statsd/config \
-v /data/graphite/logs:/var/log \
-e GRAPHITE_TIME_ZONE='UTC' \
graphiteapp/graphite-statsd
You can now check the status of the running container with the following command:
docker ps
You should see the following output:
CONTAINER ID   IMAGE                         COMMAND         CREATED         STATUS         PORTS                                                                                                                                                                                                                                                                                      NAMES
9d8c5770f26b   graphiteapp/graphite-statsd   "/entry point"   6 seconds ago   Up 6 seconds   0.0.0.0:80->80/tcp, :::80->80/tcp, 0.0.0.0:2003-2004->2003-2004/tcp, :::2003-2004->2003-2004/tcp, 2013-2014/tcp, 8080/tcp, 0.0.0.0:2023-2024->2023-2024/tcp, :::2023-2024->2023-2024/tcp, 0.0.0.0:8126->8126/tcp, :::8126->8126/tcp, 8125/tcp, 0.0.0.0:8125->8125/udp, :::8125->8125/udp   graphite
You can also check the Graphite container log with the following command:
docker logs -f graphite
You should see the following output:
    Running deferred SQL...
Running migrations:
  Applying account.0001_initial... OK
  Applying account.0002_auto_20220826_1559... OK
  Applying admin.0001_initial... OK
  Applying admin.0002_logentry_remove_auto_add... OK
  Applying admin.0003_logentry_add_action_flag_choices... OK
  Applying dashboard.0001_initial... OK
  Applying events.0001_initial... OK
  Applying events.0002_auto_20220826_1559... OK
  Applying sessions.0001_initial... OK
  Applying tagging.0001_initial... OK
  Applying tagging.0002_on_delete... OK
  Applying tagging.0003_adapt_max_tag_length... OK
  Applying tags.0001_initial... OK
  Applying url_shortener.0001_initial... OK
ok: run: nginx: (pid 58) 7s
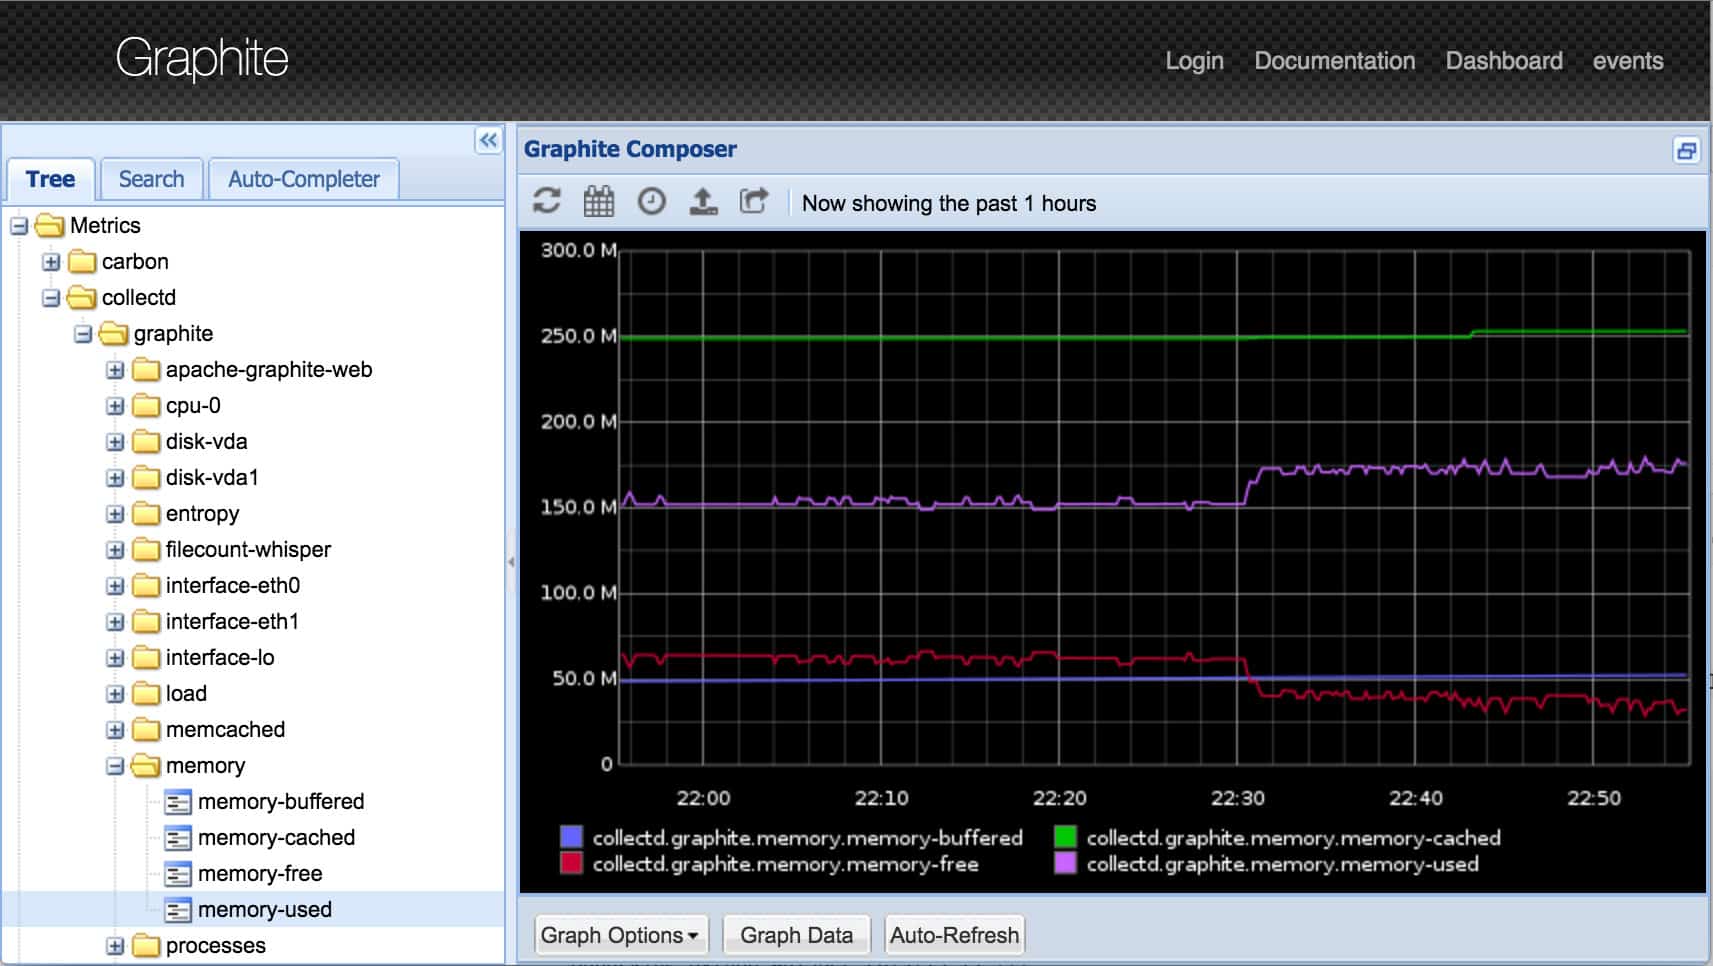
Now, open your web browser and access the Graphite dashboard using the URL http://your-server-ip. You should see the Graphite web interface on the following page:
Click on the Login button. You should see the Graphite login page:
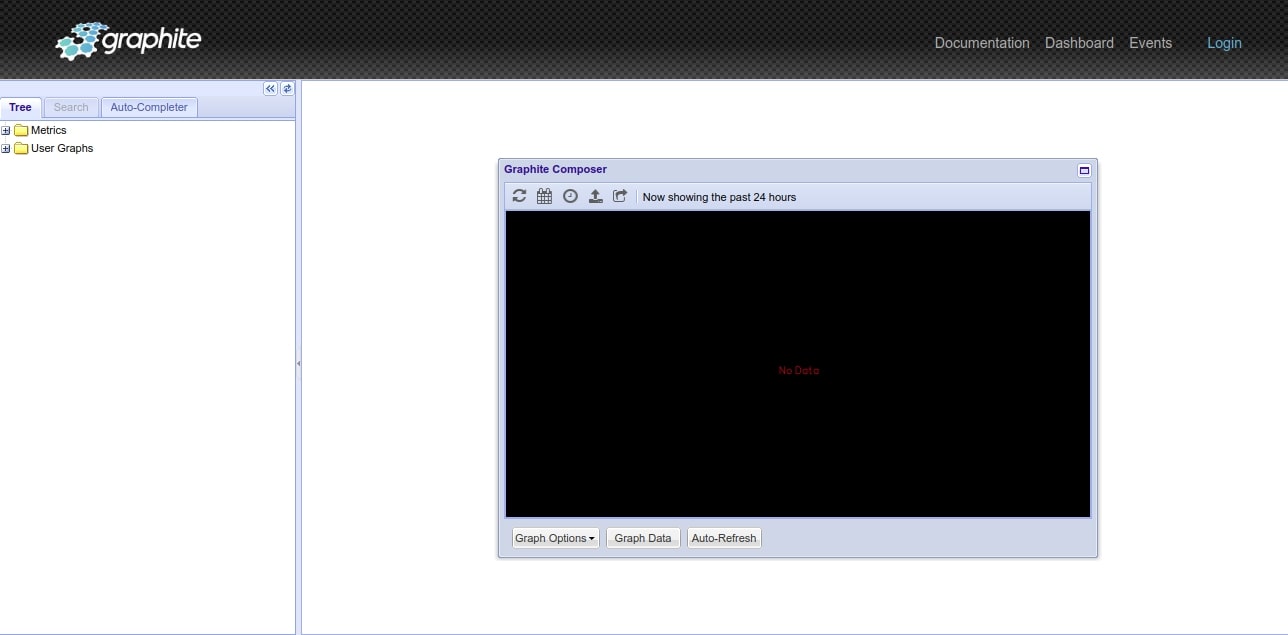
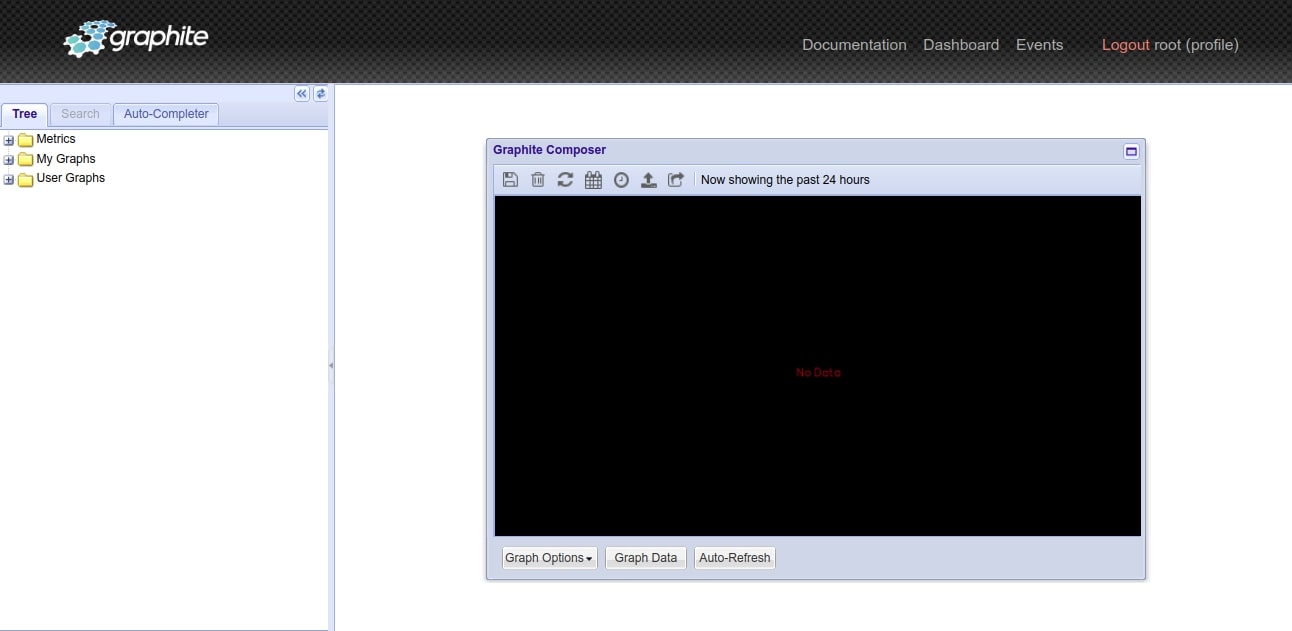
Provide default username and password as root/root and click on the Login button. You should see the Graphite dashboard on the following page:
Conclusion
In order to stay ahead of your competitors, it has become essential for organizations to stay updated about the trends and changing patterns. They must have complete knowledge about their performance or data over time. Thus, to keep track of time-series data and perform analysis, most businesses use monitoring software solutions.
To make it easy for you to choose from the hundreds, we have shortlisted the best ones. The graphite monitoring tool is the leading monitoring tool with scalable technology that helps provide advanced analytics and enables users to measure systemic patterns over time. It enables businesses to monitor data over consistent intervals. After the analysis, the tool displays data in a time-series format and visualizes data in a graphical form for better understanding.
Today, most DevOps, software engineers, system administrators, marketers, and business executives use Graphite to track resource utilization and correlate sales and operational expenses on a quarterly basis. It is a free, open-source monitoring tool that automates the data collection and display process for users. It also helps display templates in different formats like XML, CSV files, images, and JSON. In short, there are various advantages to Graphite that make it unique and resourceful.
It also has excellent features like a library of statistical and transformative rendering functions, Graphing API, an easy-to-use web interface and the composer, etc., that help identify causal relationships in the best way.
Carbon, Whisper, and Graphite-web are the main components of the monitoring tool that help collect metrics across a network and write them to a disk using Whisper. The monitoring tool, overall, helps present a feed of time-series data in a better way to users that aid in profiling data and tracking application performance.
If you are planning to invest in a monitoring tool that provides accurate information related to time-series data, it is best to invest in Graphite. No doubt, you can find many similar monitoring tools only with excellent features and properties, but still, Graphite stands out of all.
It has some unique and excellent properties that make it a great option for various businesses. But still, you can compare the above-listed features and benefits with other tools to conclude and make a better choice for your organization’s continuity and growth.

