Are you looking for a system monitoring tool that supports interaction with several data sources and delivers accurate results? Well! You have come to the right place. Here, we will discuss Grafana in detail, one of the popular open-source platforms for visualization. Also, we will pen down a few alternatives that help visualize data from time-series databases.
Grafana is a leading tool that helps store and manage web app logs and enables admins to monitor their performance. Hence, its services are not limited to only visualizing data. Grafana also allows users to create their own complex monitoring dashboards and share them with team members to explore data together.
Let’s learn how Grafana works, its benefits, drawbacks, and more about its pricing plans.
What is Grafana?
Grafana is an open-source data visualization and monitoring tool that enables businesses to query, visualize, alert on, and understand their metrics no matter where they are stored. It is a free tool used by data scientists, engineers, product managers, and analysts for tracking user behavior, types of errors popping up, and monitoring application behavior over a period of time.
The project started in 2013 when Torkel Ödegaard decided to fork Kibana. Currently, Grafana Labs runs Grafana and is available in three editions to users – Community Edition, Grafana Enterprise Stack, and Grafana Cloud.
Developed by Grafana Labs, it is a flexible and effective solution that allows users to use charts and graphs for better interpretation and understanding. Another feature that makes it a top choice is it can be integrated with several databases, such as MySQL, Influx DB, ElasticSearch, and PostgreSQL.
Developers can also create custom plugins using the tool as it is open-source. Also, with the help of Grafana dashboards, the team members can better monitor events and users’ digital footprints concerning their infrastructure or network.
Many largest corporations, like JP Morgan and PayPal, use Grafana, for it is an amazing tool and has the ability to scale. It further offers different toolsets, such as visualization, load testing, tracing, paging, etc., that make it easier for a developer to monitor, analyze and display scenarios.
How Does Grafana Work?
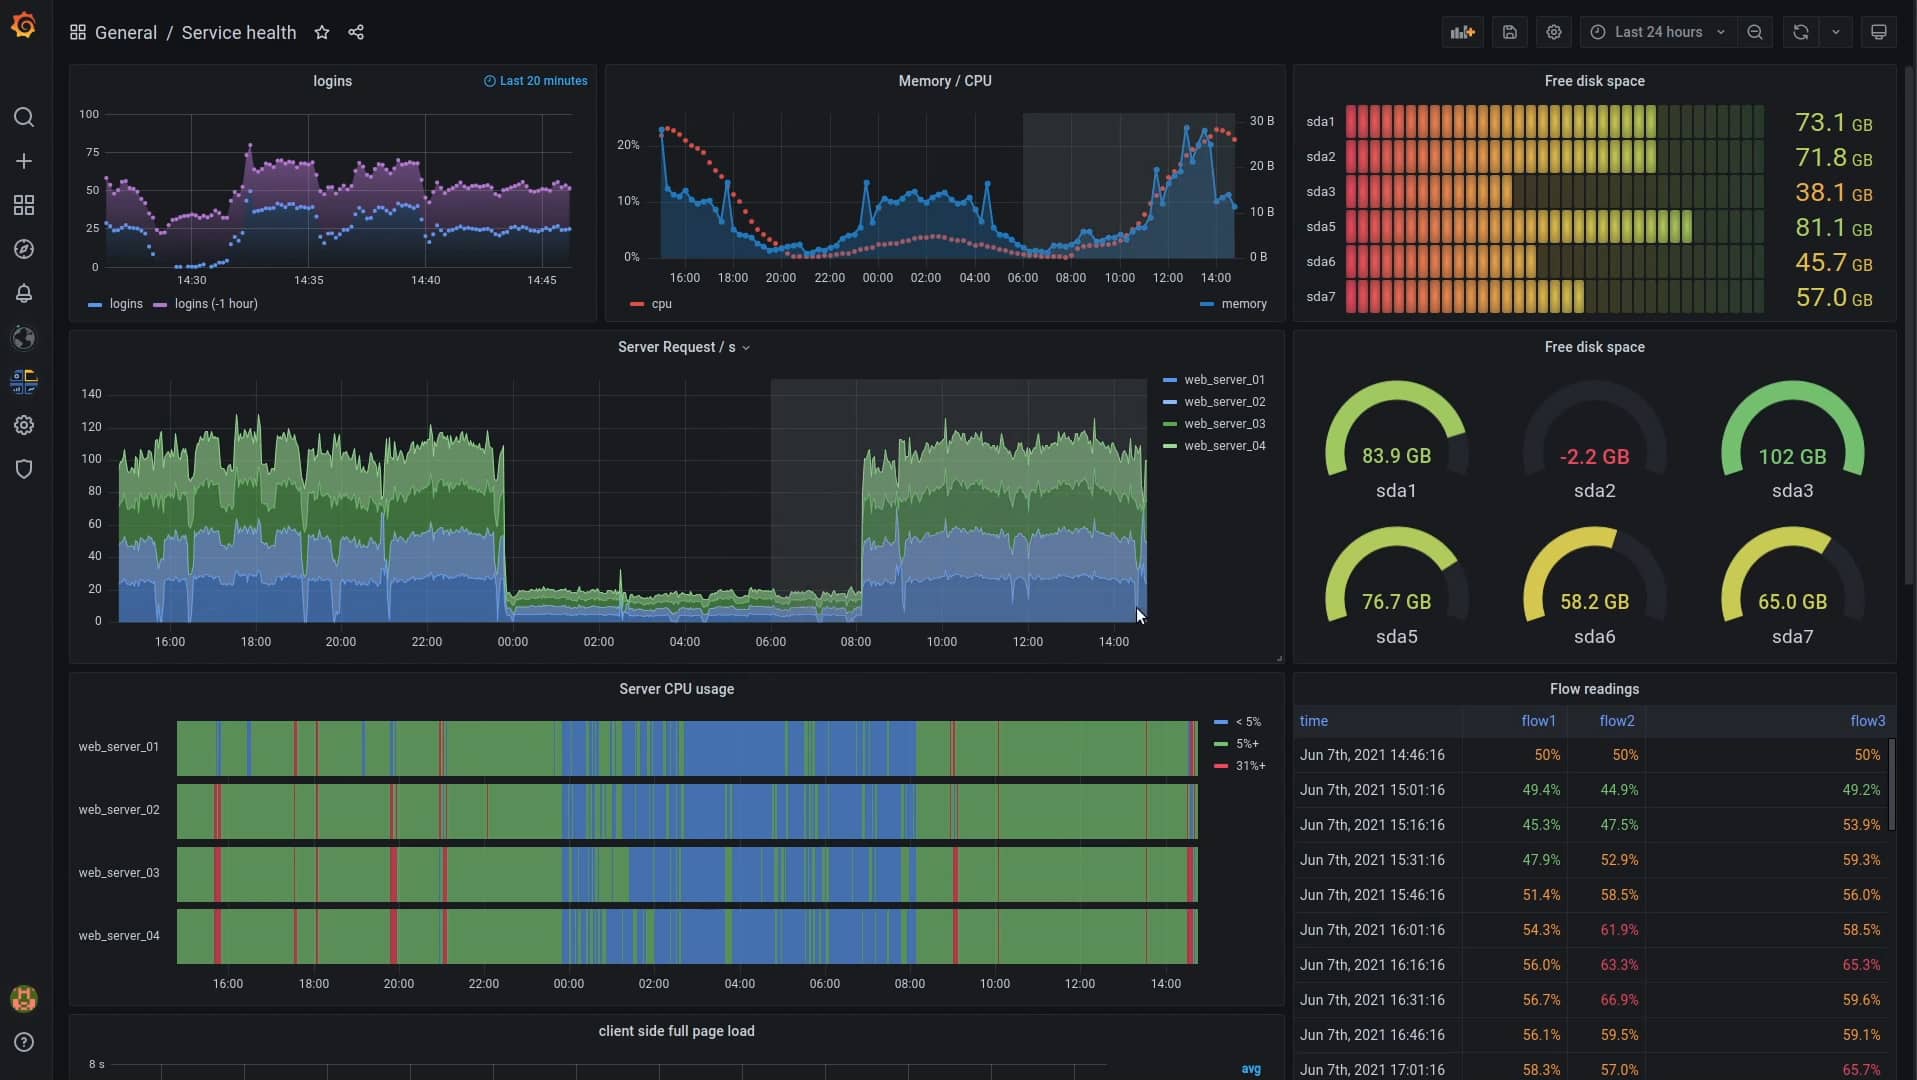
The Grafana dashboard supports multiple panels arranged in a single grid making it easier for developers to visualize results from different sources simultaneously. Also, each panel in the grid is linked to a specific data source.
Key Features
Check out some exclusive features of the Grafana monitoring tool:
- Dashboard Templating Being an open-source tool, users can customize and build a reusable dashboard for various purposes. This feature also allows users to share customizable dashboards among other team members.
- Provisioning With the help of Grafana, you can script anything and access multiple dashboards simultaneously. It supports various advanced features that enable users to create a single dashboard by clicking, dragging, and dropping options and scripting it to create multiple dashboards.
- Annotations This is an excellent feature of Grafana that helps correlate data in case you find any issue. It appears as a graph maker and allows users to manually control or fetch data from an external source or generate annotations.
- Kiosk mode and playlists Using this function, you can display your Grafana dashboards on a TV monitor and choose one from the list as per your need. Another feature supported by the tool that hides all the user interface elements is the view-only kiosk mode.
- Custom Plugins It supports multiple plugins that may help extend Grafana and allow integrating with software, visualizations, etc. With the help of these plugins, users can create and visualize a timestamp and a value with simple codes.
- Alerts/Notifications It provides quick alerts to users in case any anticipated scenario occurs. The monitoring team members are quickly notified using Slack or other communication channels.
- Permissions Some companies wish to keep certain things hidden from other team members while still sharing dashboards. In fact, if you have invested in the Grafana Enterprise package, you can build teams and set permissions as per the need in different areas, including folders, dashboards, or data source levels.
- SQL data sources Using this feature, users can easily turn all SQL databases (used for building business dashboards) into metric data.
- Authentication Another excellent feature of the Grafana monitoring tool is it supports LDAP and OAuth authentications. With the help of these features, admins can easily map users to organizations and automatically grant dashboard access to the teams in their internal systems.
Why do we recommend it?
Grafana excels in data visualization and dashboard customization, providing integration with multiple data sources like Prometheus, MySQL, and Elasticsearch. Its feature-rich environment, including alerts, annotations, and authentication options, makes it one of the most versatile monitoring tools available.
With the help of the Grafana dashboard, users can monitor, analyze, and generate quick insights. It also supports different visualization options, including geo maps, heat maps, charts, graphs, histograms, etc., that make it simple for the users to understand the metrics of their data.
You can further customize the panels and share them with other team members as per the need. The advanced querying and transformation capabilities aid in extensive exploration of the data.
Who is it recommended for?
Grafana is well-suited for developers, data analysts, and IT administrators who need comprehensive monitoring solutions with extensive customization options. It’s particularly beneficial for teams that require real-time insights across multiple platforms and wish to share customized dashboards among team members.
Pros:
- Offers integration with multiple data sources, such as Prometheus, MySQL, Elasticsearch, InfluxDB, and Splunk.
- Offers highly configurable and customizable visualization panel options
- Allows developers to create a customized dashboard
- Supports multi-tenanted options for managed service providers
- Users can easily monitor multiple sites in a single console
- Allows use of heatmaps, histograms, and charts for a better understanding of data
- Grafana is an open-source, flexible, and easy-to-use monitoring tool
- Users can create custom plugins depending on the project requirements using this tool.
- Allows hosting Grafana on-premises or any cloud platform
Cons:
- Restrictions on the dashboard – There are certain limitations supported by the dashboard design. Also, the panel organization and filtering may not provide enough flexibility for designing dashboards, but these features might improve with the release of new versions.
- Data collection and storage – Grafana is dependent on other systems for data. It does not collect data on its own, instead uses data from external systems, such as Amazon CloudWatch, MySQL, Prometheus, etc.
- Does not support all data type visualizations – Grafana is majorly known for supporting time-series data. But, the designers are working on it and looking forward to building plugins that will enable admins to visualize any type of data.
Grafana Pricing
The Grafana tool is available in three editions – Community Edition, Grafana Enterprise Stack, and Grafana Cloud. The community edition of the Grafana Open Source package is available for free and offers no professional support service to users. You can join community forums to ask queries and participate in the discussion.
It is also compatible with platforms like Linux, macOS, Windows, and Docker.
The Grafana Enterprise Stack package is a paid version that includes a professional support service. The plan is tailored by combining different modules, including:
- Grafana Enterprise It includes all units of the community edition and offers professional support. Further, it supports proprietary plug-ins that help automatically feed data in from third-party tools.
- Grafana Enterprise Logs Another paid version includes access controls and professional support. It is a combination of Loki and Grafana tools that also supports the multi-tenanted option for MSPs.
- Grafana Enterprise Metrics It is a scalable solution that offers a global view of metrics, Out-of-the-box self-monitoring, centralized access control, and authentication. Further, one can easily deploy and customize the Grafana Enterprise Metrics approach.
- Grafana Enterprise Traces Under this package, users can scale from one to hundreds of tenants, create and manage tokens, and aggregate data from multiple clusters. It is a distributed tracing system based on the open-source project Tempo that also feeds in Prometheus data and logs from Loki.
Grafana Cloud supports full-stack monitoring and allows admins to collect, store, visualize, and alert on data. It is a SaaS plan built with modern distributed systems techniques. It provides automatic upgrades, 24×7 on-call support, and 30 days of log and trace retention.
Under the Free tier Grafana Cloud, only three active users have permission to access 10,000 metrics, 50GB logs, and 50GB trace data.
Best Grafana Alternatives
There are various system monitoring tools available in the market that offer great service. Here we have listed a few alternatives to Grafana that can also be beneficial for your business.
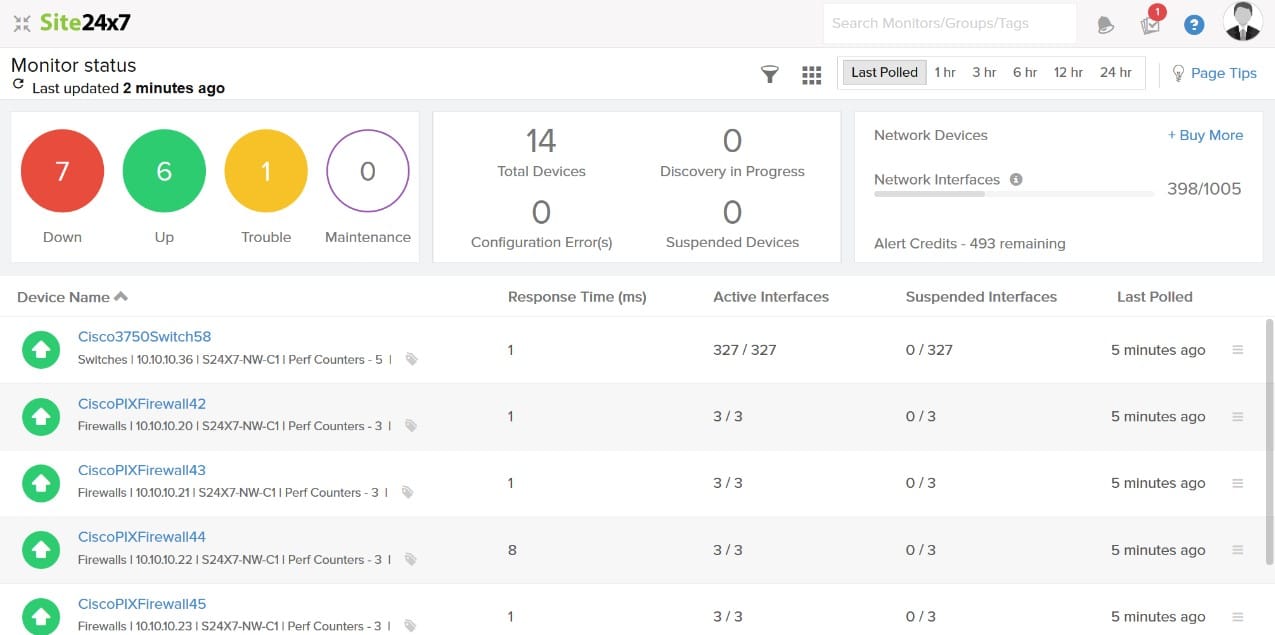
- Site24x7 – FREE TRIAL is a suite of monitoring tools and solutions that are used by most small businesses and large corporations for tracking user experience across websites, networks, servers, and applications. It comes with a subscription plan, i.e., users can choose a specific module and subscribe to it. Even the IT admins and DevOps teams can access the tool to monitor the health, status, and performance of their digital assets in real-time.
The AI-powered monitoring tool offers clear visibility into on-site, cloud, and virtualization platforms that help pinpoint issues in real-time and troubleshoot them quickly. You can register for a 30-day free trial.
- Datadog A paid system monitoring tool that allows users to examine thousands of applications at any scale, anywhere. With the support of its plugins, you can also collect data and feed it into Grafana. Most information technology (IT) and DevOps teams prefer Datadog as an alternative to Grafana, for it can be deployed on-premises or as a software as a service (SaaS). Also, it supports various cloud service providers, such as Red Hat OpenShift, Google Cloud Platform, etc. Other features include customizable dashboards, user notifications, 250+ product integrations, API access, support for multiple languages, etc. It also offers a 14-days free trial.
- Dynatrace An easy-to-use, all-in-one platform that provides constant monitoring of your system and applications. With the help of its excellent features, users can quickly fix, accelerate, and optimize servers and software applications. The Dynatrace monitoring tool also provides extensive cloud support and AI-driven problem detection features that help discover issues in seconds. Additionally, its out-of-the-box serverless functions help deliver a great digital customer experience. Using this popular tool, enterprises can monitor and analyze all application’s database activities, application performance, manage complex mainframe applications, analyze service call sequences, etc. It monitors every component of your hybrid cloud environment as well as its relationships and interdependencies. You can sign up to get a 15-day free trial.
- Kibana The Grafana project was designed by forking Kibana. Hence, Kibana comprises most of the features supported by Grafana, such as it has a free and open user interface. Users can also visualize all their Elasticsearch data and navigate the Elastic Stack using the leading tool. Further, the tool supports histograms, line graphs, pie charts, sunbursts, and other features that make it easier for users to understand the metrics of the data. You can also explore location data by leveraging Elastic maps and visualize custom layers and shapes. Another feature that makes Kibana a great alternative is it allows users to perform time series analysis on collected data. Click here to get a free cloud trial.
- Tableau Another great alternate solution when looking for monitoring tools and offers a seamless end-to-end experience. The best part about this tool is you can add a session on the content management policy to archive or delete old content. It supports AI-powered analytics and integration with existing technology investments. Further, it is quite easy to implement and supports different types of visualization options. Users can use the drag-n-drop functionalities of Tableau to create interactive visuals in minutes. Additionally, it supports complex computations, data blending, and dashboarding options to deliver accurate insights and aid in better decision-making. Sign up to get a free Tableau trial.
- Splunk A free data representation tool used by enterprises to unlock innovation, ensure security, and drive resilience. Users can build custom applications as per their specific needs and deliver full-fidelity observability and unified security using this trusted tool. It also provides end-to-end data coverage and is used, especially for log and traffic data. Using this powerful tool, enterprises can also defend against threats and strengthen their cyber defenses. Further, it provides real-time views on the health and performance of the entire tech stack. There are various benefits of choosing Splunk over other tools. Also, it provides a 60-day free trial (on-premises version) and a 14-day free trial (Splunk cloud).
Conclusion
Grafana is a powerful open-source data visualization tool that can be used to monitor and analyze data. It is an easy-to-use platform that provides a variety of features making it a valuable tool for engineers and analysts.
With the help of this powerful open-source data visualization tool, users can easily monitor multiple sites in a single console and integrate with multiple data sources, such as Prometheus, MySQL, Elasticsearch, InfluxDB, and Splunk.
Its various features and benefits make it a top choice. But, it also provides a few drawbacks, which is why most enterprises look for alternatives. Follow the above-listed alternatives of Grafana, compare, and then make a final call for your business.


