Earlier, we all had been through a phase when our local shops were shut down, and there was no earning. As a result, many people started moving to digital platforms and created websites for their businesses to serve customers without any stoppage or delays.
This phase made most small businesses realize the importance of the Internet and why it is necessary to survive and thrive in the time to come. Getting a website designed for your business is just not enough.
You can’t start making sales the next morning. You’ll need to optimize your website so that it ranks well and is visible to more users. As a result, you will improve customer experience, get more leads, and chances of sales will improve.
To make it happen, you’ll need to analyze and optimize the website. There are many tools available in the market that can help ease the process of analysis and monitoring websites.
Catchpoint is one such interesting web performance monitoring tool that helps various digital companies track and monitor websites and their performance. Here, we will discuss Catchpoint in detail, covering its features, benefits, and drawbacks. Further, we have also shortlisted a few alternate solutions one can invest in based on their requirement and budget.
What is Catchpoint?
Catchpoint is a monitoring tool that helps businesses track the performance of all elements available in Web systems and mobile applications. Today many online advertising service providers, travel agencies, media platforms, and tech companies are using this popular tool to improve the user experience and optimize performance.
Since its launch in 2008, the web monitoring tool has gained a lot of popularity.
Currently, it is popularly known by many companies for its extensive network of testing capabilities. Also, the monitoring tool provides end-to-end visibility into every layer of the service, tests applications internally behind a firewall, analyzes historical trends, and timely fixes blind spots for a better user experience.
It is an all-in-one monitoring tool that enables businesses to track all the networks, endpoints, synthetic, and real users. Get real-time insights on the performance of applications with the Catchpoint system.
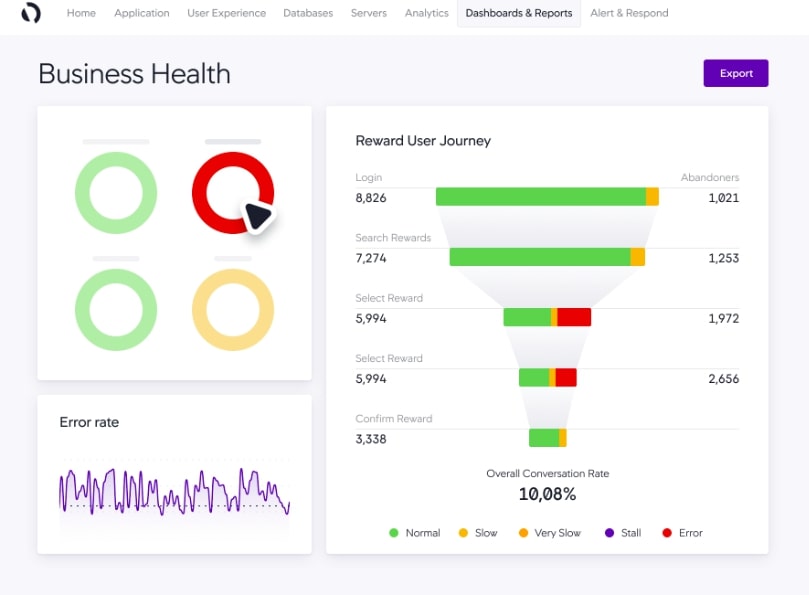
Another advantage of the Catchpoint system is you can create quality reports and visualize application performance using different options, including line graphs, scatter plots, bar charts, heat maps, etc.
If you are looking for a tool that will help in measuring and improving user experience in the best possible way, look no further. Google, Pinterest, and Verizon are a few high-profile companies that invested their money into the Catchpoint system.
Features of Catchpoint
Here are a few features of Catchpoint that can be highly beneficial for your business and its web performance.
Synthetic monitoring
Unlike other monitoring tools, Catchpoint supports 500+ global nodes for synthetic monitoring. When it comes to selecting a comprehensive testing solution on a global scale, most experts would recommend investing in Catchpoint.
Apart from testing the maximum number of nodes and locations, the tool also classifies these nodes into three sections – backbone, last-mile, and mobile monitoring. Backbone nodes focus on testing quality and are in complete control of your teams.
Last-mile nodes simulate the slow speed of the web or mobile application and offer a comprehensive view of your users’ experience. Lastly, the Wireless nodes or mobile nodes are responsible for making sure that the mobile applications are accessible via 3G and 4G LTE networks.
Apart from testing web applications, one must also focus on improving the mobile experience for better results.
Real-user performance monitoring
Get access to in-depth metrics showcasing users’ interaction with various products, real-time issues, and more information. You can also customize the metrics you want to measure from the available options on the screen.
Glimpse, Catchpoint’s real-user monitoring product, allows users to perform A/B tests to determine which variations perform better. Further, it helps analyze collected data about real users’ engagement levels on your site. You can also compare graphs of key performance indicators using this feature.
Alert options
The tool supports built-in support systems that update users immediately when a threshold is surpassed. It sends an email containing contextual details describing what triggered the alert. Also, one can integrate the Catchpoint system with other monitoring and communication tools, such as VictorOps, Slack, PagerDuty, etc.
Integration with third-party tools helps reduce incoming duplicated alerts. As a result, you don’t need to spend extra time checking multiple sources to gauge your performance.
Pros:
- An ideal solution for businesses operating globally as it supports 500+ testing nodes.
- Allows users to test applications internally behind a firewall with the help of its on-premises agent.
- Supports real-user monitoring and synthetic monitoring features
- Using the historical trends, users can compare the performance and get an estimate on how much they have improved/degraded over time
- It supports various options like heat maps, bar charts, line graphs, etc., that enable a business to create a customizable visualization of performance metrics
- Gives access to customize metrics as per the need
- Tracks SLA compliance
- Conducts A/B testing to check which variation performs better
- Helps analyze real users’ engagement levels
- Alerts immediately when a threshold is surpassed.
- Monitors delivery to corporate endpoints
- Allows integration with third-party tools for DevOps and collaboration tools
Cons:
- For a free trial, you require a sales rep for setting up the monitoring tool.
- Only Internet Service Providers in the United States, United Kingdom, and France have access to use the last-mile testing feature.
- Lacks server and security monitoring
- Does not support integration for JIRA or Jenkins
Pricing and Plans
Catchpoint does not provide its pricing plan. Instead, it demands users to directly contact Catchpoint for the quote. Also, there is a free trial with a limited duration of 14 days. You can also book a demo to check how Catchpoint monitors web performance and mobile applications.
Website Link: https://www.catchpoint.com/
The Best Catchpoint Alternatives
No doubt, Catchpoint is a great tool that offers excellent monitoring services and enables businesses to improve the response time of different mobile applications and websites. However, it is not the only option that you can invest in for monitoring the website and optimizing it for better performance. There are many more companies that offer similar services and products.
A few companies look for alternatives for Catchpoint because it lacks server and security monitoring. There can be other reasons too why companies are switching to other similar services.
Here are a few alternatives to Catchpoint that can work best for your business and help improve web performance.
1. Site 24×7 Digital Experience Monitoring Tool – FREE TRIAL
Site 24×7 is a monitoring tool that most businesses use to track, analyze, and evaluate how well their services and applications in an organization perform. You can even run application tests during the pre-production stage with this tool. Additionally, IT teams can monitor and measure the performance in real-time across all channels.
Key Features
- Monitor Real user and application performance
- Supports Synthetic and API monitoring
- Application Testing is present
- Debug errors
Why do we recommend it?
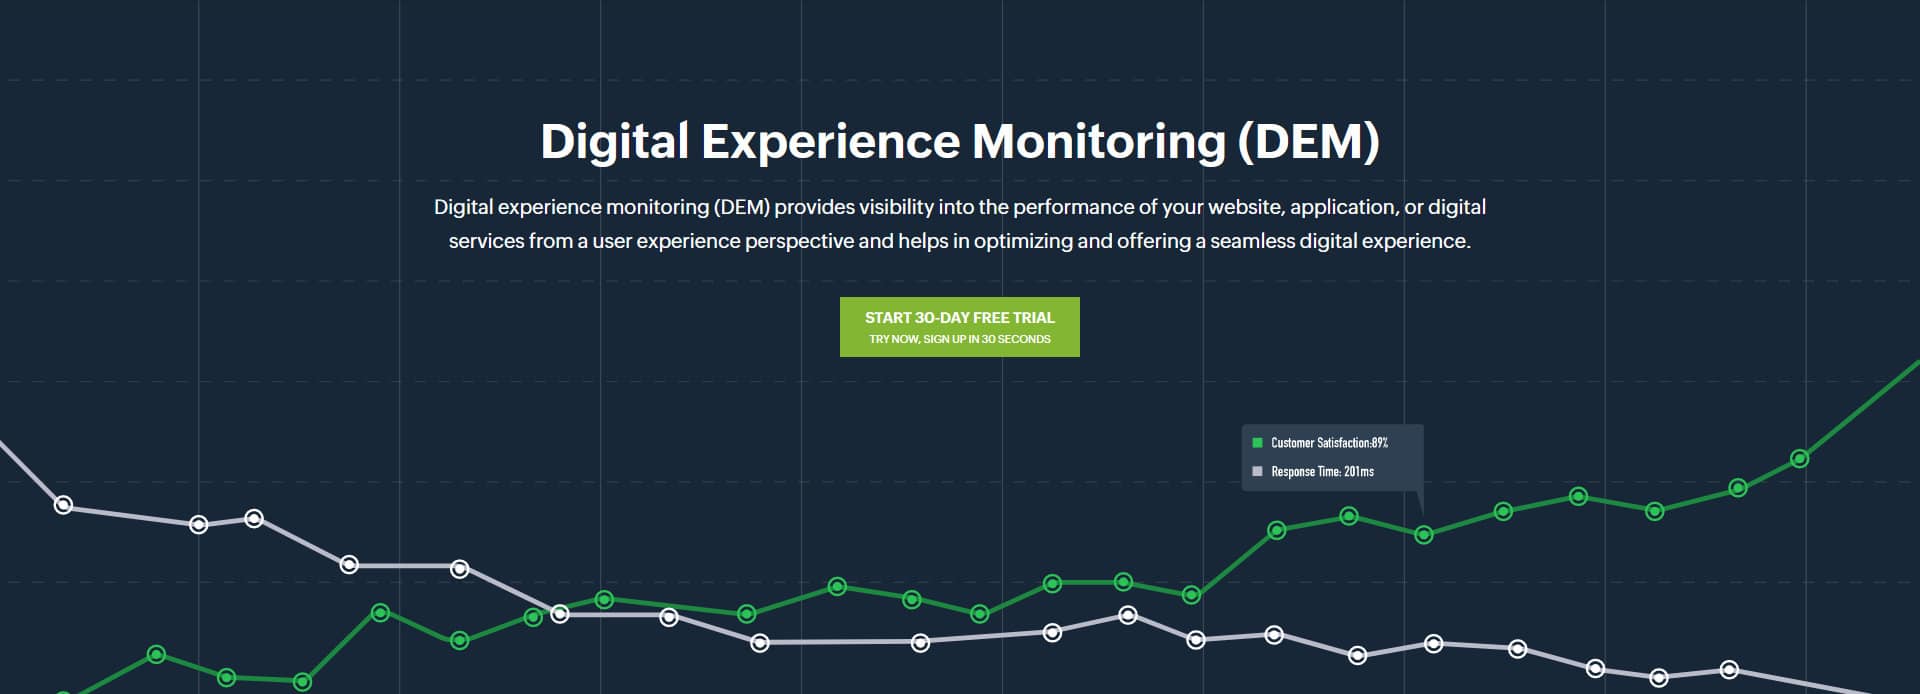
With the help of digital experience monitoring (DEM) solutions, enterprises can monitor and analyze the intricacies of user journeys with websites and web applications. It even offers in-depth insights into critical transactions of an application, user sessions, errors, and overall performance.
The comprehensive tool even includes the three pillars of observability and the power of AIOps that help record even the smallest detail and insights helpful in delivering unparalleled customer experience.
Basically, the Digital Experience Monitoring Tool is a great option for professionals and IT teams who want to optimize their websites and applications for end-customer user experience. With the help of this tool, you can gain quick insights into JavaScript errors, user sessions, and other areas that can affect or impact the user’s digital experience.
Who is it recommended for?
Any business that focuses on improving and offering a seamless digital experience must go in for a Site 24×7 Digital Experience Monitoring (DEM) solution. DevOps and IT teams can further utilize this tool to help fix problems with end-user-app systems or services.
Pros:
- Site 24×7 helps businesses track and analyze key metrics and user interactions with digital platforms
- It provides clear visibility into the IT environment that makes it easier to discover trends, identify patterns, and focus on areas that require improvement
- Helps reduce the mean time to repair (MTTR) by quickly discovering and resolving issues
- Gains automated insights and uses AI-powered alerts to identify issues and resolve problems more effectively
Cons:
- For smaller organizations, the cost could be an issue depending on the scale of usage
EDITOR'S CHOICE
Site24x7’s Digital Experience Monitoring Tool is the editor’s top choice because it offers valuable insights into the performance of applications and services across all channels. It comes with a comprehensive feature set that helps measure the application performance in real-time, detect errors, and troubleshoot them. You can even track and reduce the risk of application malfunctioning by detecting issues beforehand. It provides complete visibility into front-end and backend servers that help clearly understand how the different services and resources affect your end users. Further, with crash analytics, you can fix performance problems with your mobile apps.
Download: Get a 30-day free trial
Official Site: https://www.site24x7.com/digital-experience-monitoring.html
OS: Cloud-based
2. OpManager
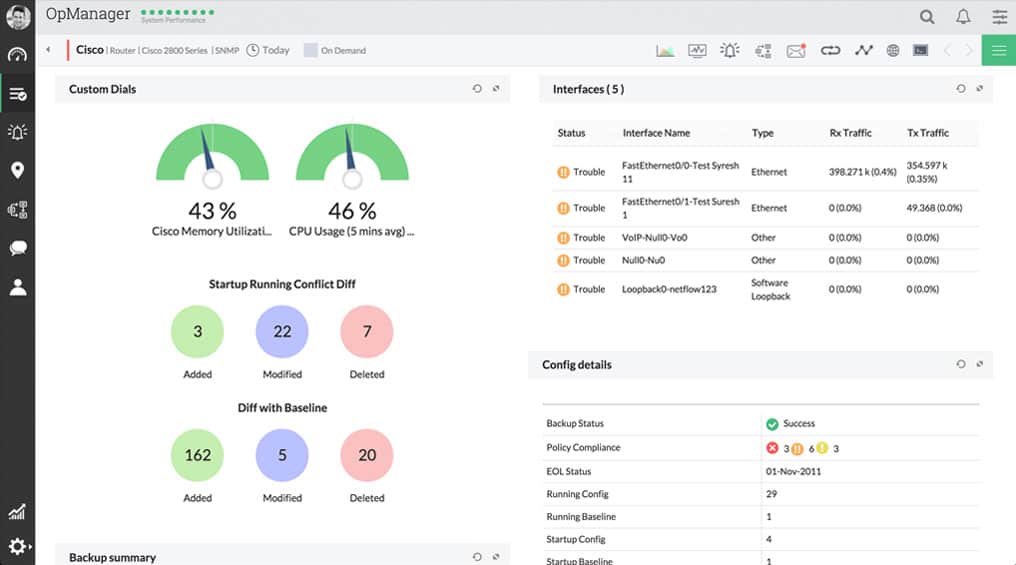
OpManager is a great tool when it comes to monitoring websites and global URLs. It is ideal for large companies that carry complicated multi-site networks.
Today, most companies are switching to a tool that offers continuous monitoring of the websites and checks each URL to ensure they are reachable and serves the right page information to the users. Further, the tool allows users to check the availability of the website, its health, and its performance.
Apart from monitoring websites, you can also track the performance of networks, physical and virtual servers, WAN, storage devices, and more with OpManager. However, the free version supports monitoring for only three network devices.
You can also set request parameters for the submission forms. Get access to real-time data and instant updates or alerts if a text is missing from the website.
3. Dynatrace
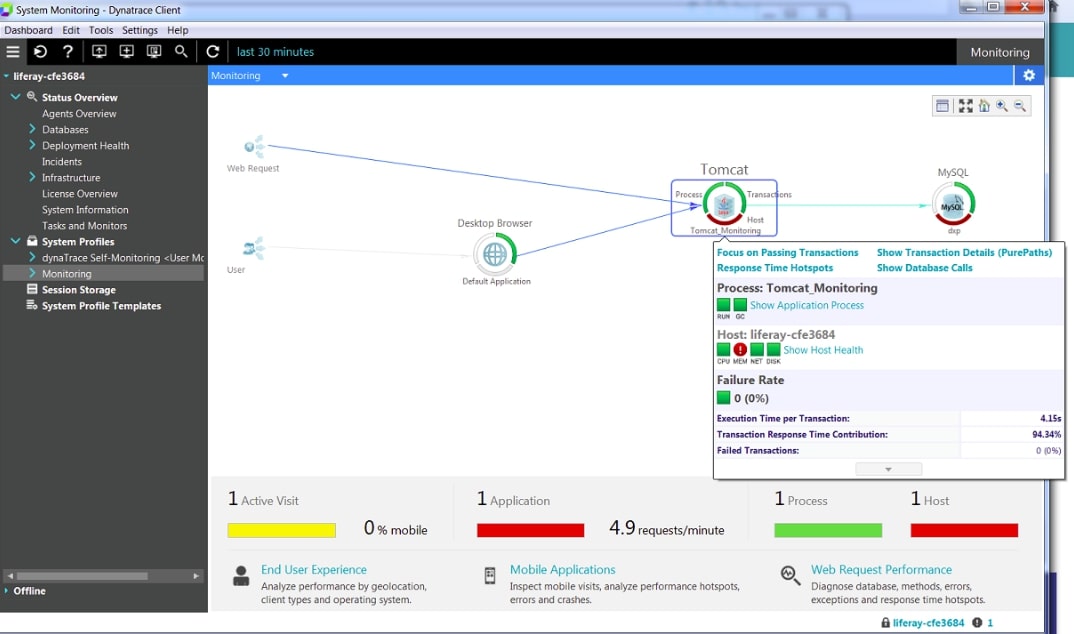
Dynatrace is a SaaS system that can monitor all networks, regardless of their location. The single, easy-to-use platform is also known as Dynatrace Software Intelligence Platform.
Most companies trust Dynatrace because it allows users to monitor all application performance, cloud performance, serverless functions, track business analytics, digital experience, and AIOps. Also, with the help of Dynatrace, companies can easily monitor the infrastructure.
Dynatrace is all-in-one. fully automated, an enterprise-grade monitoring tool that checks if your software is delivering high performance. Also, it checks the availability of software applications that results in improved computing processes, customer satisfaction, quick response time, and more.
If you are looking for a monitoring tool that helps automate orchestration with open APIs and offers cloud support with all database technologies, look no further.
4. AppDynamics
AppDynamics is another great alternative that uses APM Tools and an analytics-driven approach to fix performance issues. It has excellent agents or plug-ins or extensions that collect data and provide full visibility into the performance of your entire stack (application, runtime, and behavior).
The SaaS platform offers a combination of application, server, and network monitoring services.
Along with the agents, it also has controllers present in the tool to collect real-time performance data from the agents, visualize the overall performance, and re-send the instructions to the agent.
With AppDynamics, you can also auto-discover the flow of traffic requests, create topology maps, monitor the digital experience of your users, key metrics across devices, and more.
5. LogicMonitor
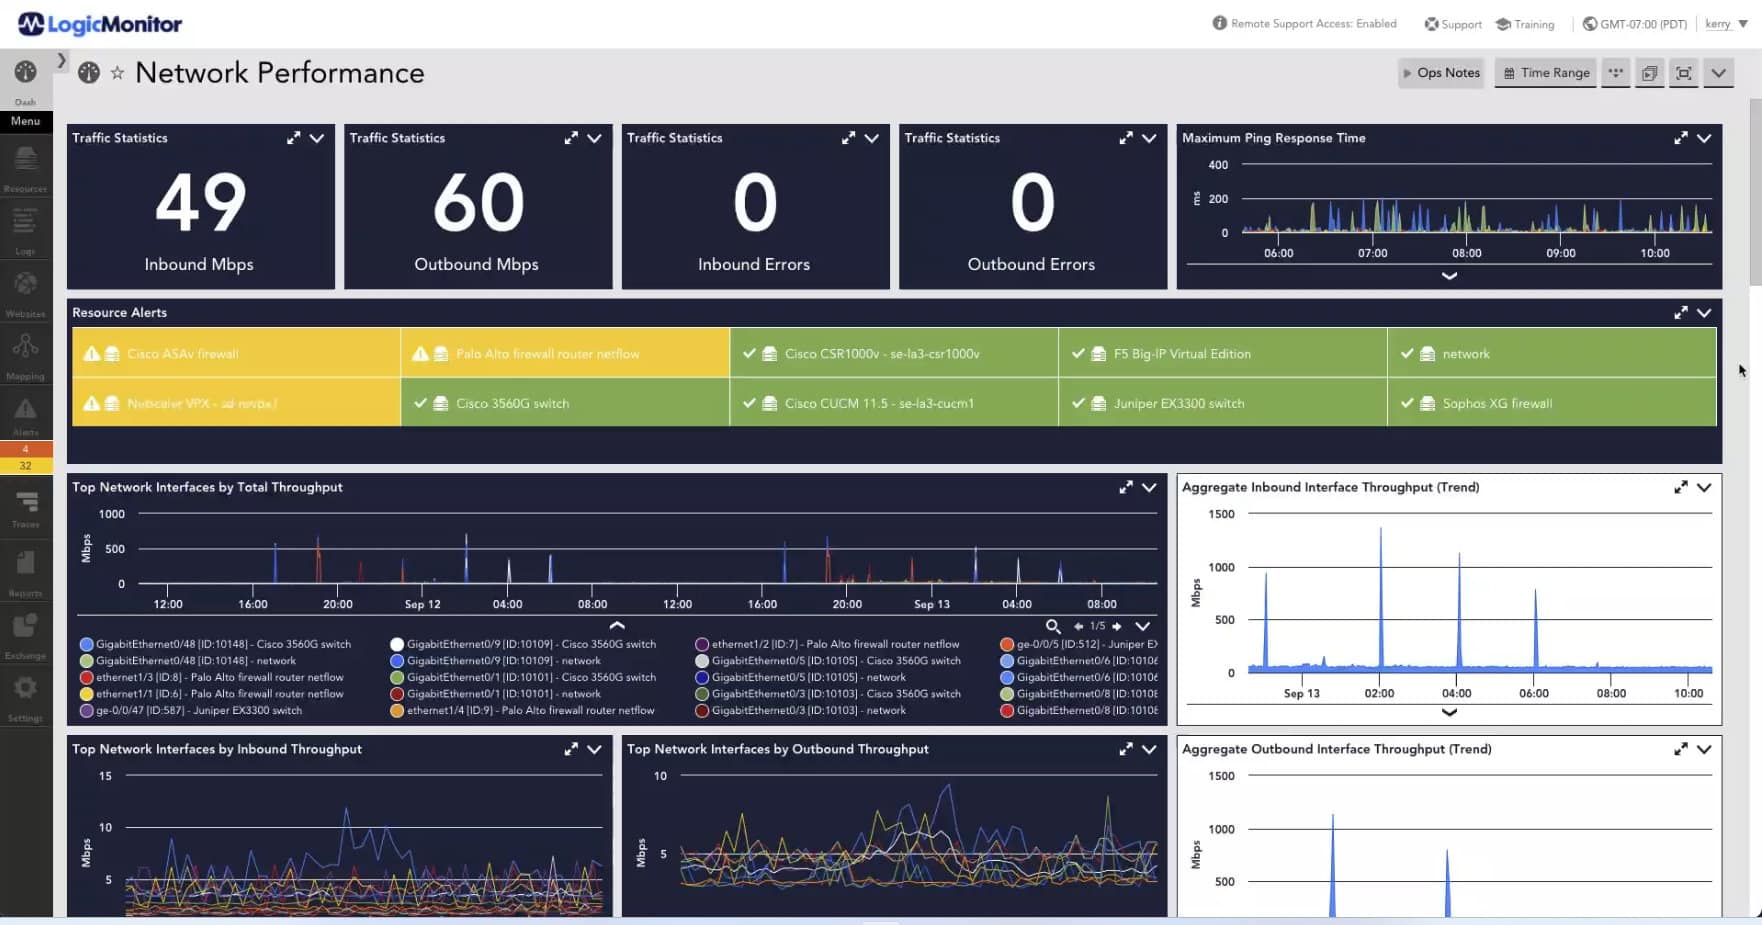
LogicMonitor is a SaaS-based unified observability tool that most enterprises, ITOps, developers, and managed service providers use for monitoring networks, applications, servers, etc. It is one of the secure cloud-based monitoring tools that provide full visibility into a hybrid IT environment.
Right from monitoring on-premises servers to cloud services, the monitoring tool covers every facet of your configuration using its advanced features. It automates configuration, performs network scanning, supports 2,000+ pre-configured integrations, offers 24/7 expert support, quick enterprise deployments, etc.
Another feature of LogicMonitor is users get access to flexible alerting and reporting options. If you are looking for a hybrid infrastructure monitoring platform that works fast and smarter, we recommend investing your time in LogicMonitor.
6. Datadog real user monitoring
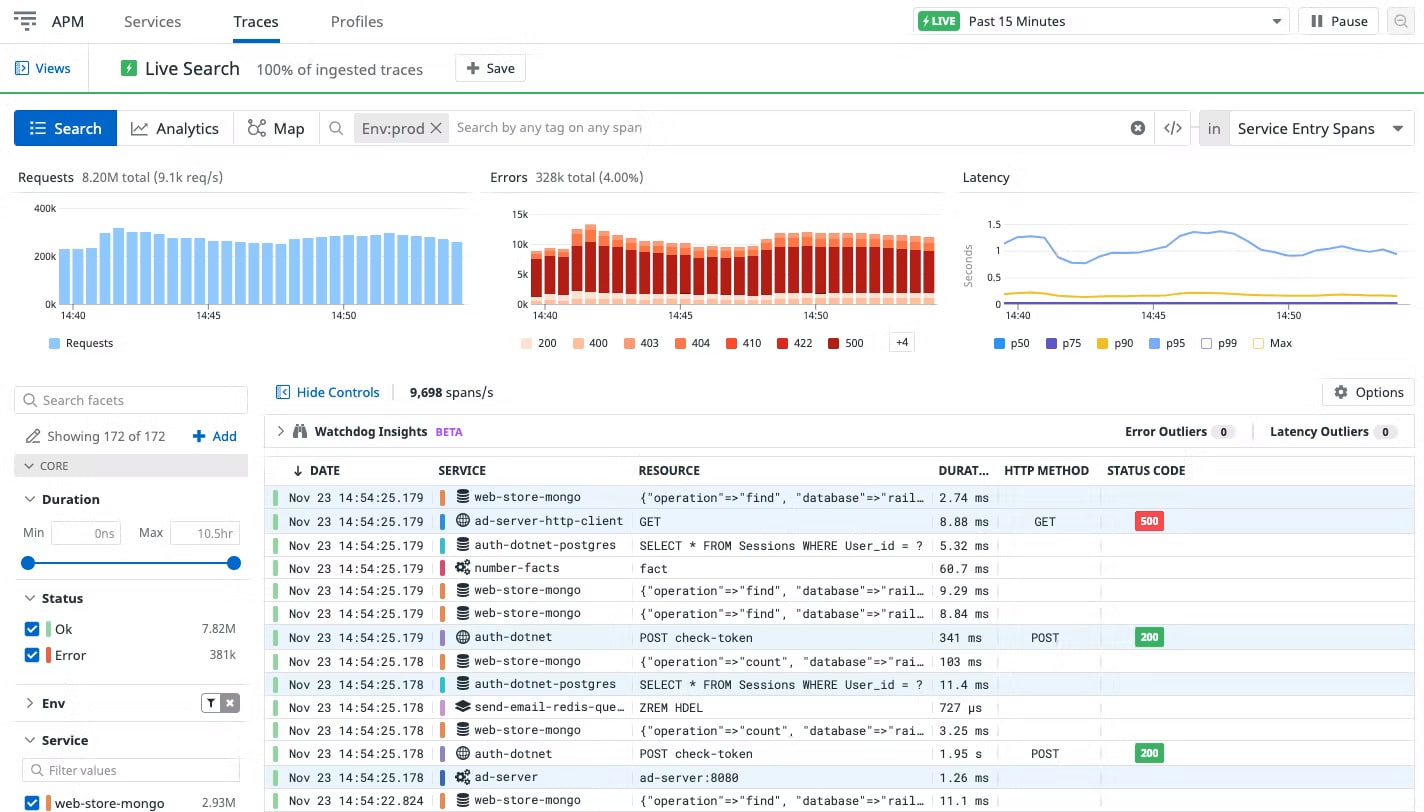
Datadog is a user activity tracking system tool that provides end-to-end visibility into web and mobile applications. You can select the monitoring services from the menu in Datadog and slot them according to your requirements.
It also monitors servers and networks apart from the web and mobile applications. Get complete device information, and insights into the application’s frontend performance, and analyze traffic using the powerful real user monitoring tool – Datadog.
Using Datadog, businesses can quickly detect poor user experience and fix issues found across the stack. Other options include resolving JavaScript errors, analyzing usage across devices, collecting custom attributes from user journeys, etc.
Conclusion
Is your website bounce rate high? Do you feel people visit your website but soon shift to other platforms? Well! It happens because your website is not properly optimized. Many factors contribute to bad web performance. To fix these issues and deliver optimal performance, it is a must to monitor your website and check its availability.
If your website speed is slow and the content available on the website is not properly optimized, it will impact your search rankings. Hence, investing in Website monitoring is the best option for you.
Under website monitoring, the users constantly examine the website status to ensure optimal function. It further helps prevent loss of revenue and increases traffic score.
Catchpoint is one such popular web monitoring tool that helps in monitoring the website’s status, availability, and performance. Businesses can track the performance of all elements available in the Web systems using the popular monitoring tool. Apart from monitoring different facets of our infrastructure, the tool also provides end-to-end visibility into every layer of the service, tests applications internally behind a firewall, analyzes historical trends, etc.
Do you know Catchpoint supports 500+ global nodes for synthetic monitoring? It also tracks real-time issues and has built-in support systems that instantly alert users when a threshold is surpassed.
It is an all-in-one monitoring tool that tracks networks, endpoints, and real users but lacks server and security monitoring. It is also a reason why companies look for tools that offer similar services.
OpManager, Dynatrace, AppDynamics, LogicMonitor, and Datadog real user monitoring are a few alternate options businesses can invest in. These tools also offer full visibility into your web and mobile applications. Further, a few perform continuous scanning and auto-discover the flow of traffic requests.
Compare the above-listed tools and choose the one that suits your requirement and budget.

