A mainframe is a computer that runs a program. Let’s first understand what a mainframe is. A mainframe is a highly efficient, fast, and powerful computer. In the finance, insurance, and healthcare industries, mainframes are usually used to run large-scale computing processes that require high performance, reliability, and security.
The mainframe system testing process involves testing software services and applications developed. Controlling costs and ensuring quality are crucial for application development. Testing the mainframe is intended to provide the application’s performance, reliability, and quality of service.
Here is our list of the best mainframe monitoring tools:
- SolarWinds Server & Application Monitor (SAM) – FREE TRIAL With this tool organizations can monitor IDM database servers and the health and performance of their host servers and network infrastructure. Get a 30-day free trial.
- ManageEngine Applications Manager – FREE TRIAL Provides an agentless way to keep track of your IBM Db2 environment’s health, metrics, and availability. Start a 30-day free trial.
- Datadog A cloud-based monitoring platform that offers to monitor across the entire IT infrastructure of an organization.
- IBM Db2 Data Management Console A solution designed by IBM to help DBAs manage and monitor their Db2 databases at scale.
What are the Mainframe Testing Tools?
Mainframe testing tools are components used to test the mainframe systems of large organizations. Web-based testing is also related to mainframe testing. Users of IT Central Station (soon to be Peerspot) test mainframe applications against test cases developed using specific metrics using “job batches”.
A deployed code is used in the mainframe testing process and is typically carried out using several data combinations set into an input file. The mainframe applications are accessed through a terminal emulator, standalone software installed on a client’s machine – to maximize time, productivity, and system health.
Mainframe testing tools should assist in observing the entire software cycle and distributed systems, resulting in potentially actionable data, monitoring, and documenting the agility of system integration and functionality. IT Central Station users need proven authorization, authentication, integrity, confidentiality, and availability.
New apps on a mainframe’s data/logic require reliable integration with distributed SLM tools. At IT Central Station, the IT decision-makers look for the best tools that combine SLM and testing. Users will look for links between debugging, test-data generators, performance management, release management, and all other tools required to build an organization’s software.
Overall, mainframe testers require data interaction analysis to build and then run the ever-changing ideal software configuration. This is necessary because mainframe testing is most visible in critical industries like insurance, finance, retail, and government, where massive amounts of data are constantly processed.
Implementing the mainframe testing process provides IT Central Station IT and DevOps professionals lasting value and ROI. To achieve the best integration of technical support, developers will prepare a plan to modify a process or a specific part of a release cycle. After receiving the documents, the team will assess how the mainframe testing will affect existing processes. Different aspects of the testing will necessitate customization, while others will rely on out-of-the-box functionality.
As a result, the two parts – mainframe testing requirements and mainframe testing integration – will provide an overall picture of enterprise software integrity.
Mainframe Attributes
- Virtual Storage
- With this technique, a processor can simulate a more significant primary storage than the actual real storage.
- This technique aims to store and execute various tasks by effectively utilizing memory.
- Disk storage is used to extend actual storage.
- Multiprogramming
- Allows a computer to manage more than one program simultaneously. However, only one program can control the CPU at any given time.
- It is a facility provided to make effective use of the CPU.
- Batch Processing
- It is the procedure of dividing any task into smaller units known as jobs.
- A job may cause multiple programs to run sequentially.
- The job scheduler determines the order in which the jobs should be executed. Job scheduling is based on priority and class to maximize throughput.
- JOB CONTROL LANGUAGE [JCL] is used to provide information necessary for batch processing. This language describes batch jobs, which include programs, data, and resources.
- Time-Sharing
- The terminal device allows each user to access the system in a time-sharing system. Instead of submitting jobs to be run later, the user enters commands to be executed immediately.
- This is known as interactive processing. It allows direct interaction between the user and the computer.
- “Foreground Processing” refers to time-sharing, and “Background Processing” refers to batch jobs.
- Spooling
- SPOOLing means Simultaneous Peripheral Operations Online.
- SPOOL devices are used to store the output of programs/applications. Spooled output can be sent to output devices like a printer (if needed).
- It utilizes the advantage of buffering to maximize the use of output devices.
How to perform Mainframe Testing?
Mainframe testing is typically done manually, but it can be automated with tools such as Datadog application performance analyzer, CA application fine tuner, and so on. Regardless of the model, the following shift-left approach should manage testing activities.
- Planning A testing team should prepare test scenarios and cases in advance, collaborating with the project management and development teams. The team should include resources with the necessary mainframe knowledge. For preparing test plans, the system requirement document, business requirement document, other project documents, and input from the development team will be helpful.
- Scheduling A testing schedule that is realistic and in sync with the project delivery schedule should be created.
- Deliverables Should be well defined, with no ambiguity, and within the scope of test objectives. Execution should follow the plan and deliverables. Periodic reviews with the development team should assess progress and make course corrections.
- Reporting Periodically, test results should be shared with the development team. In the event of an emergency, the testing team can contact the development team for immediate corrections to maintain continuity.
- Advantages The robust testing process eliminates unnecessary rework, optimizes resource utilization, reduces production downtime, improves user experience, increases customer retention, and lowers overall IT operation costs.
Characteristics of Mainframe Testing Tools
The advantages of using test automation are apparent. Still, integrating test automation can be difficult. A smooth transition requires the right mainframe testing tools and the right platform.
- Repository testing It allows testers to create, review, and improve manual and automated tests. Audits can also benefit from test reporting and archiving.
- Cross-device testing The best mainframe testing tools allow you to test across desktop, API, cross-browser, and mobile environments.
- Codeless tool The testing team will create tests much more quickly if the tool is codeless. It also allows non-technical team members to participate in mainframe testing. Thus, testers can continuously carry out mainframe testing rather than waiting for the mainframe developer to do so. As a result, agility and constant optimization are ensured.
What is the significance of mainframe testing?
Companies must remain competitive while keeping costs under control as the world moves toward digital transformation. Meanwhile, the company provides a world-class user experience and can outpace competitors on market time. Many organizations find it challenging to accomplish this task, and it is even more difficult for businesses that use mainframes due to outdated testing processes.
Mainframes are still used in heavily regulated industries such as banking, finance, insurance, and healthcare. Why?
Here are some of the reasons:
- Reliability The hardware can withstand system crashes.
- Scalability Multiple transactions can be processed in a single mainframe application. As a result, it requires fewer resources and is simple to scale up.
- High availability Mainframes are designed to run continuously and without interruption. Even during updates, there is no need to reboot.
Testing is a critical component of mainframe efficiency. The issue is that today’s business environments move much faster than traditional mainframe development and testing can. It is because most mainframe testing is still done manually. Therefore, mainframe testing needs to adopt test automation to faster meet the current demand for higher quality.
To ensure the performance of your mainframe applications now is the time to implement continuous testing, testing earlier and more frequently before releasing an application to production. Using mainframe testing tools is one efficient way to accomplish this.
How does mainframe testing work
What is the procedure for mainframe testing?
You ensure that the system or application is market-ready by performing mainframe testing. Traditional manual mainframe testing entails running job batches against the test cases developed. It is typically carried out in deployed code. Combinations set into an input file are used to apply and test the deployed code. Testers access mainframe applications via a terminal emulator on a client’s machine.
The procedure determines how a specific process will be altered during the release cycle. The testing team is given a document that contains the requirements and specifies how many functions will be affected by the change. Typically, the percentage ranges between 20 and 25 percent of the application.
Testing the requirements
It involves testing the application for the changes specified in the requirements document.
Testing the integration
Verifying the integration process with the affected application. There are multiple steps to follow for mainframe testing:
- Shakedown The first step is to ensure that the codes that have been deployed are in the testing environment. The codes are then checked for technical errors before being approved for testing.
- System testing Evaluate the functionality of individual subsystems integrated into the mainframe system, their independent performance, and interoperability.
- Job batch testing The mainframe tester runs batch jobs to test the scope of data and files. The test results are then recorded by extracting them from the output files.
- Online testing If batch testing was done in the back end, online testing is done in the front end, testing the mainframe application’s entry fields.
- Integration testing Involves examining the data flow between the mainframe’s back and front end. The interaction between the batch job and the online screen. Before proceeding to the following stages of mainframe testing, the tester validates and approves the performance.
- Database testing We test the mainframe’s database at this stage. This test validates and approves the database in which the mainframe application’s data is stored.
- System integration testing We can now test how the system performs and interacts with other systems. This ensures that the mainframe system integrates with others in an orderly fashion.
- Regression testing Ensures that the various systems do not harm the system under review.
- Performance testing The next step is to test the system’s performance to detect bottlenecks and other activities that may impede the application’s performance or scalability in its specific environment.
- Security testing Before the system is approved, it must be tested to see if it can handle security attacks. Mainframe and network security are tested in integrity, confidentiality, availability, authorization, and authentication.
The Best Mainframe Monitoring Tools
1. SolarWinds Server & Application Monitor (SAM) – FREE TRIAL
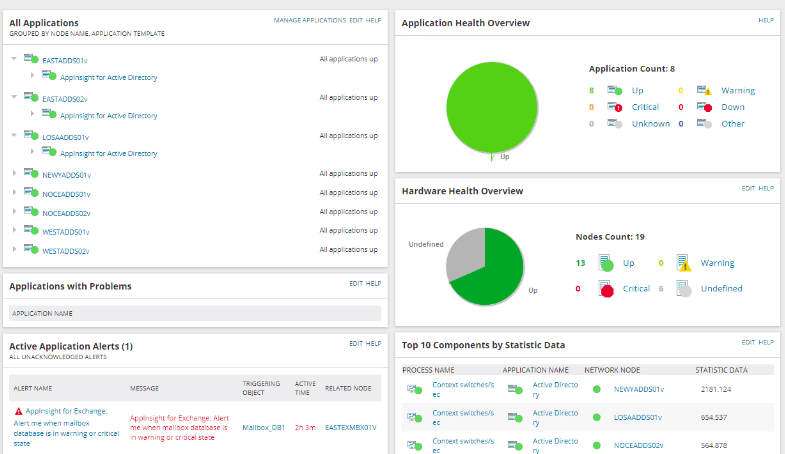
With SolarWinds Server & Application Monitor (SAM), organizations can monitor IDM database servers and the health and performance of their host servers and network infrastructure.
Key Features
- Monitoring of networks, servers, and applications
- Determining dependencies
- Using 1200 alerts and monitoring templates
Why do we recommend it?
SolarWinds SAM offers an all-in-one solution for monitoring not just servers and databases but also network infrastructure. Its extensive library of alerts and monitoring templates, including specific ones for IBM Db2, makes it a highly versatile and time-saving tool for complex IT environments.
SAM includes templates for dozens of servers and databases, including IBM Db2. The templates simplify the monitoring process on multiple platforms. When the agent is deployed, it will start reporting performance metrics like average buffer size, total available database space, index hit ratio, average read time, and several more.
Who is it recommended for?
We recommend SolarWinds SAM for businesses and organizations that require comprehensive monitoring across a mix of networks, servers, and databases. It is especially useful for IT departments that manage diverse types of servers and databases, as its wide array of pre-configured templates can simplify the monitoring process significantly.
Click here to download your SolarWinds Server & Application Monitor (SAM) fully functional 30-day free trial.
2. ManageEngine Applications Manager – FREE TRIAL
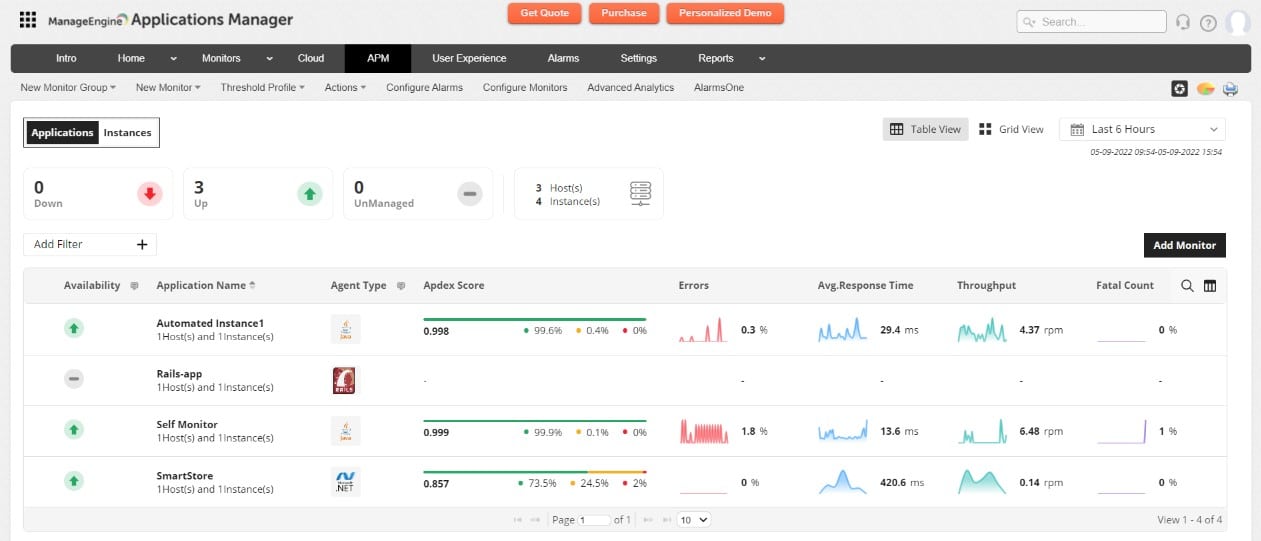
ManageEngine Applications Manager provides an agentless way to keep track of your IBM Db2 environment’s health, metrics, and availability. You can use the tool to collect and view core database server metrics from any browser. The reporting dashboard is essential, but it does the job for most Db2 environments.
Key Features
- Business-ready
- Bulk discounts
- Personalized query tracking
Why do we recommend it?
ManageEngine Applications Manager stands out for its agentless monitoring capabilities, making it easier to deploy and manage. Its dashboard may be simple but it provides all the essential metrics that a DBA would need to make informed decisions for performance improvement and root cause analysis.
Who is it recommended for?
This tool is ideal for small to medium-sized businesses looking for a straightforward, agentless monitoring solution for their IBM Db2 environment. It’s also a good fit for DBAs who need to quickly assess the health and performance of databases without the overhead of additional software installations.
The information gathered allows DBAs to see the big picture by distilling performance metrics into actionable performance improvements. Root cause analysis also aids administrators in being alerted to new issues and determining where to look for solutions.
Start with a 30-day free trial.
3. Datadog
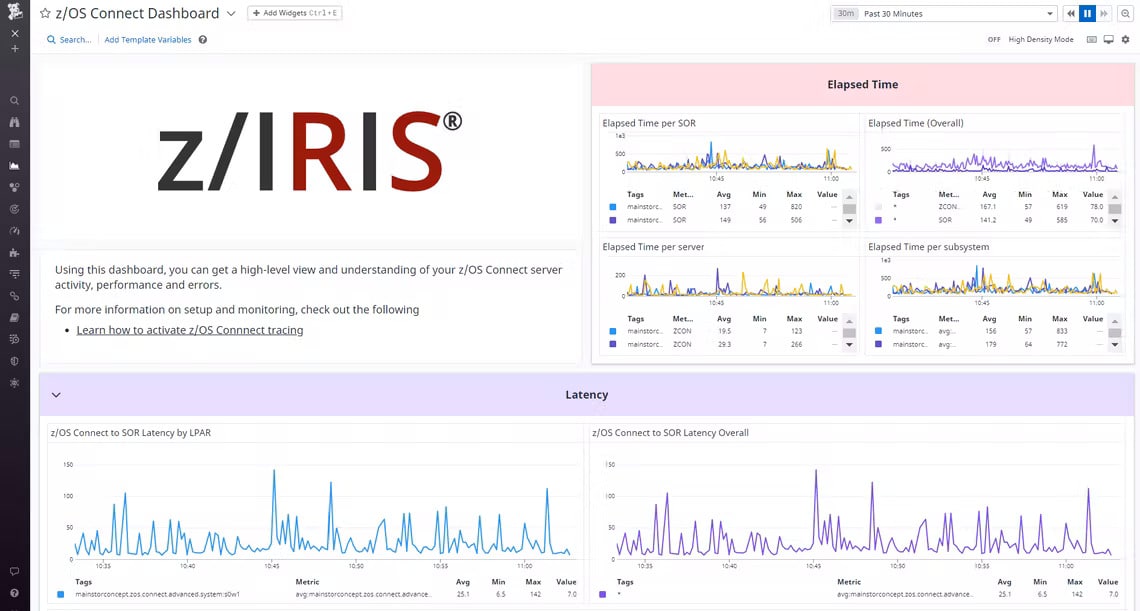
Datadog is a cloud-based monitoring platform that offers to monitor across the entire IT infrastructure of an organization. With prebuilt modules for specific environments, including IBM Db2, Datadog makes integrations incredibly easy.
Key Features
- Integrated monitoring
- via plug-and-play dashboards
- Easy pricing
Why do we recommend it?
Datadog offers seamless integration with prebuilt modules for IBM Db2, along with customizable dashboards. This flexibility allows you to monitor critical Db2 metrics efficiently, which is invaluable for making data-driven decisions.
Who is it recommended for?
Datadog is suitable for medium to large enterprises that require robust, cloud-based monitoring across their entire IT infrastructure. Organizations using IBM Db2 will find Datadog’s prebuilt modules and easy customization particularly beneficial for real-time performance tracking and alerts.
This integration features a built-in dashboard that monitors and reflects the most crucial Db2 metrics, such as query rates, database size, and server resource consumption. Datadog offers a variety of monitoring and reporting templates that can be customized to fit your needs, or you can build your own from scratch.
4. IBM Db2 Data Management Console
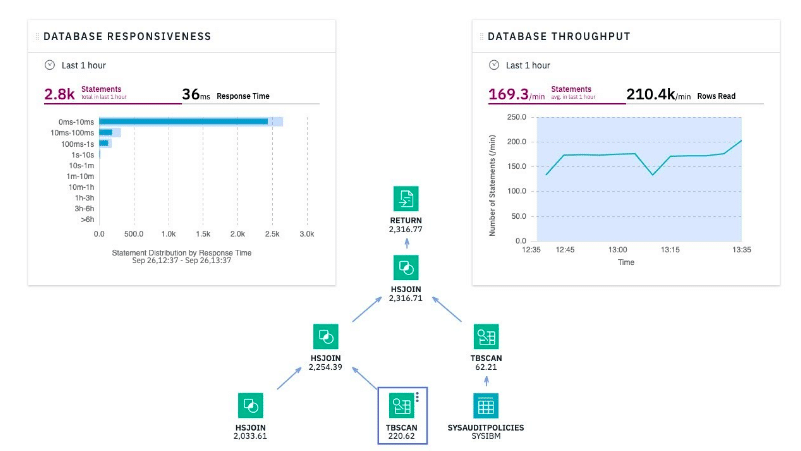
The IBM Db2 Data Management Console is a solution designed by IBM to help DBAs manage and monitor their Db2 databases at scale.
Key Features
- Monitoring IBM Db2 exclusively
- Integrated SQL editor
- for database object management
Why do we recommend it?
The IBM Db2 Data Management Console is tailor-made for Db2 environments, offering specialized features like an integrated SQL editor and real-time historical monitoring. Its browser-based interface makes it user-friendly and convenient for DBAs.
Who is it recommended for?
This tool is particularly suitable for Database Administrators who are specifically working with IBM Db2 databases. Organizations that have made a substantial commitment to IBM’s Db2 will find this console indispensable for scaling their database management efforts.
Users can manage and administer their databases using the browser-based console, which tracks performance metrics across individual databases and clusters. It includes live database object editing and real-time historical monitoring for quick performance benchmarking.
Benefits of Mainframe Monitoring Tools
- Improve visibility Consolidate views and build cross-platform application views. Bring mainframe management information and tasks into one place with a dashboard. Share detailed metrics with other tools.
- Outsmart performance issues Use automated tools to resolve issues that are prioritized and isolated. Provide intelligent alerts, targeted reporting, and links to related tools to prevent outages and performance problems.
- Collaborative problem resolution By integrating ChatOps into Slack, Microsoft Teams, or Mattermost, you can improve cross-team collaboration for problem resolution.
- Increase availability Use diagnostic tools to assess health. Determine if there will be delays or outages.
- Isolate problems Analyze code, server resources, or external dependencies for bottlenecks. Identify performance bottlenecks by monitoring new applications and reducing steps.
- Make informed decisions System events should be explained to IT personnel to help them understand their impact on the business. Learn about the performance of applications, APIs, and subsystems to identify root causes of problems and resolve them efficiently.
What are the best practices for mainframe monitoring?
- Be aware of alerts Too many alerts will quickly result in fatigue and, worse, ignored warnings. Take care to create alert logic that is triggered when humans are genuinely required to intervene.
- Consider alert levels Primary crashes or brief downtime can be routed to low-level analysts, but more severe issues must be escalated to managers as soon as possible. Assigning different severity levels to problems makes categorization and escalation easier.
- Consider the medium as well When is an email alert sufficient, and when must a text message or other mobile notification be used? Remember that receiving too many texts can quickly lead to alert fatigue and missed alerts.
- Improve your dashboards Because the dashboard is where most analysts will spend the majority of their workday, it makes sense to ensure that the most critical information is front and center and secondary information is easily accessible.
- Separate from the alert system, create an escalation plan The problems are vastly different, and the solutions are similarly diverse. There may be rudimentary escalation procedures in your alert system, but a seemingly minor server problem can quickly become a major one. IT monitoring tools, for instance, may only report that an off-site server is unavailable, bearing down on the data center.
- Remember that redundancy is beneficial Monitoring the health of a specific node should never be relied upon from a single source. Is it true that if your monitoring tool loses access to a server log, it means there is a problem with the server or the network cable? If you do not have a secondary data source to monitor network traffic, you will not troubleshoot these types of issues more effectively.
- Look out for outliers It is acceptable to have an average web page response time of 0.3 seconds, as long as it does not imply that a small percentage of your users are experiencing response times of 30 seconds or more and falling through the cracks. An intelligent monitoring strategy must consider all data, not just the median, and troubleshooting must frequently address the unique set of variables causing problems for a small portion of the end-user base.
Best Mainframe Monitoring Tool for Ultimate Efficacy
Optimize application performance by analyzing service dependencies and distributed traces with Datadog. With built-in performance dashboards for web services, queues, and databases, you can see the state of your applications from start to finish.
Features:
- Traces can be collected, analyzed, and searched across fully distributed architectures.
- and correlate with logs and underlying infrastructure metrics.
- Manage all your containers, cloud instances, on-premises, and hybrid architectures in one place.
- You can troubleshoot issues faster with Datadog’s Service Map by automatically mapping data flows and cluster services based on their dependencies.
- Flame graphs provide end-to-end visibility across distributed services, lowering latency.
- A real-time performance dashboard can be built for over 400 technologies using drag and drop.
The Bottom Line
Mainframe monitoring can ‘make’ or ‘break‘ your business. But here comes the role of the mainframe monitoring tools, in which you integrate mainframe monitoring into your entire business ecosystem; you can dramatically improve operations across a wide variety of metrics, from service availability to overall business performance and profitability.

