

Today most companies use technology to gain a competitive advantage and speed better decisions. But to smoothly run, deliver and support IT services, one must keep track of IT activities, networks, endpoints, and devices. With so many threats and challenges, it has become essential for enterprises to constantly monitor and maintain the IT Infrastructure of their organization.
As your business grows, so do its components. As a result, it becomes difficult to keep track of performance metrics and application component logs without proper tools. Also, with constant monitoring, businesses can deliver top-notch services to all users. Hence, each enterprise must invest in infrastructure monitoring tools and save time.
Rather than assigning duties to your employees to manually detect and identify problems, it is best to invest in infrastructure monitoring tools that identify errors before they cause disruption.
These tools automate the process of identifying and analyzing the health and performance of critical systems. Further, they help reduce errors and enable businesses to deliver optimal performance.
Graphite and Datadog are monitoring tools used by most enterprises that work differently. Graphite is a graphical monitoring tool that monitors and displays data in a time-series format. Datadog, on the other hand, is a comprehensive monitoring tool that collects, analyzes, and represents data in different forms.
Here, we will compare the features, price, and other aspects of both tools to make it easier for you to understand how they can help fulfill your business requirements.
Graphite Product Highlights
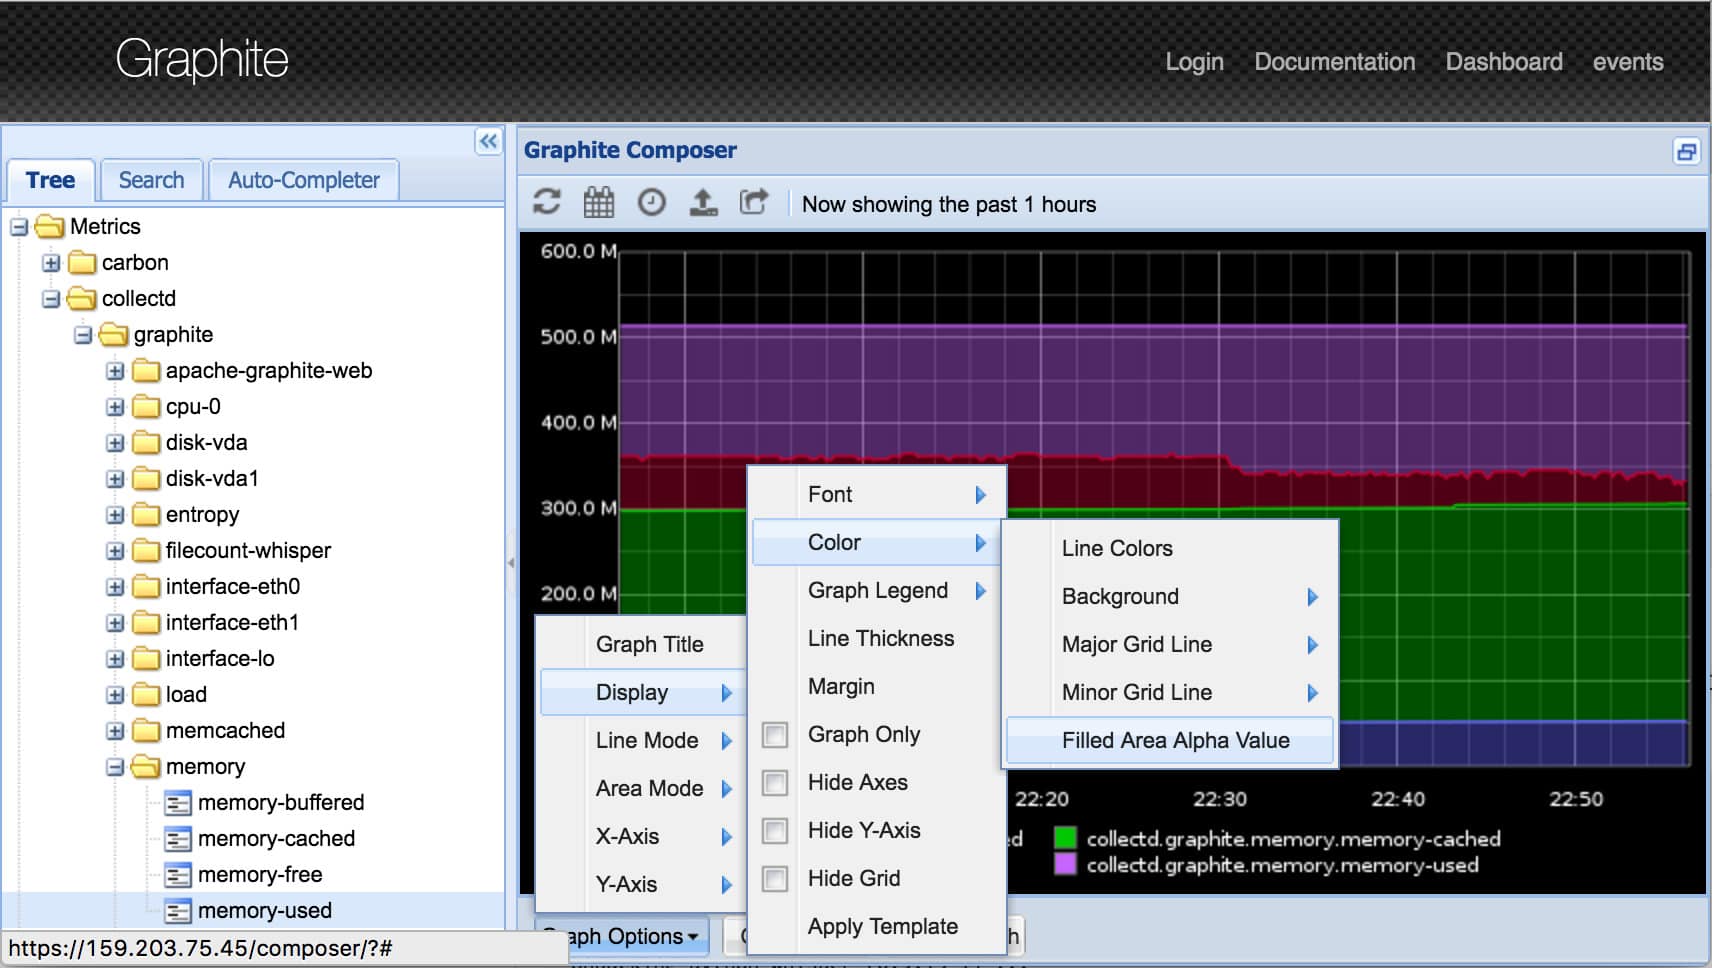
Graphite is a popular monitoring tool designed and developed by Chris Davis at Orbitz in 2006. The graphical monitoring tool was later released under the open-source Apache 2.0 license in 2008. It is highly beneficial for businesses that want to monitor and display data in a time-series format.
Why do we recommend it?
After installing Graphite and navigating its interface, we found the tool excels in real-time data visualization, particularly in a time-series format. Its three core components—carbon, whisper, and graphite UI—work seamlessly to deliver accurate and timely results.
For example, it can display the CPU usage and hard disk performance in the form of a graph. It only receives data and extracts categories of information from it for display. This type of tool is best used to process activities like throughput rates and temperature reports.
Who is it recommended for?
Graphite is an excellent choice for DevOps teams and businesses that require real-time monitoring of servers, websites, and applications. Its capability to visualize time-series data makes it particularly useful for tracking throughput rates and temperature reports
Graphite is a free, open-source monitoring tool designed to create graphs from the provided data series. It is easy to feed information into Graphite. The three main components of the tool – carbon, whisper, and graphite UI work together to store, query, visualize, and deliver accurate results.
If your DevOps are looking for a tool that can help track the performance of servers, websites, and applications, and visualize the information in time-series data format, go for Graphite.
Today, many companies, including Etsy, GitHub, Hive Streaming, Simple, Reddit, Booking.com, and EA Games, use Graphite to represent data series in graphical form.
Datadog Product Highlights
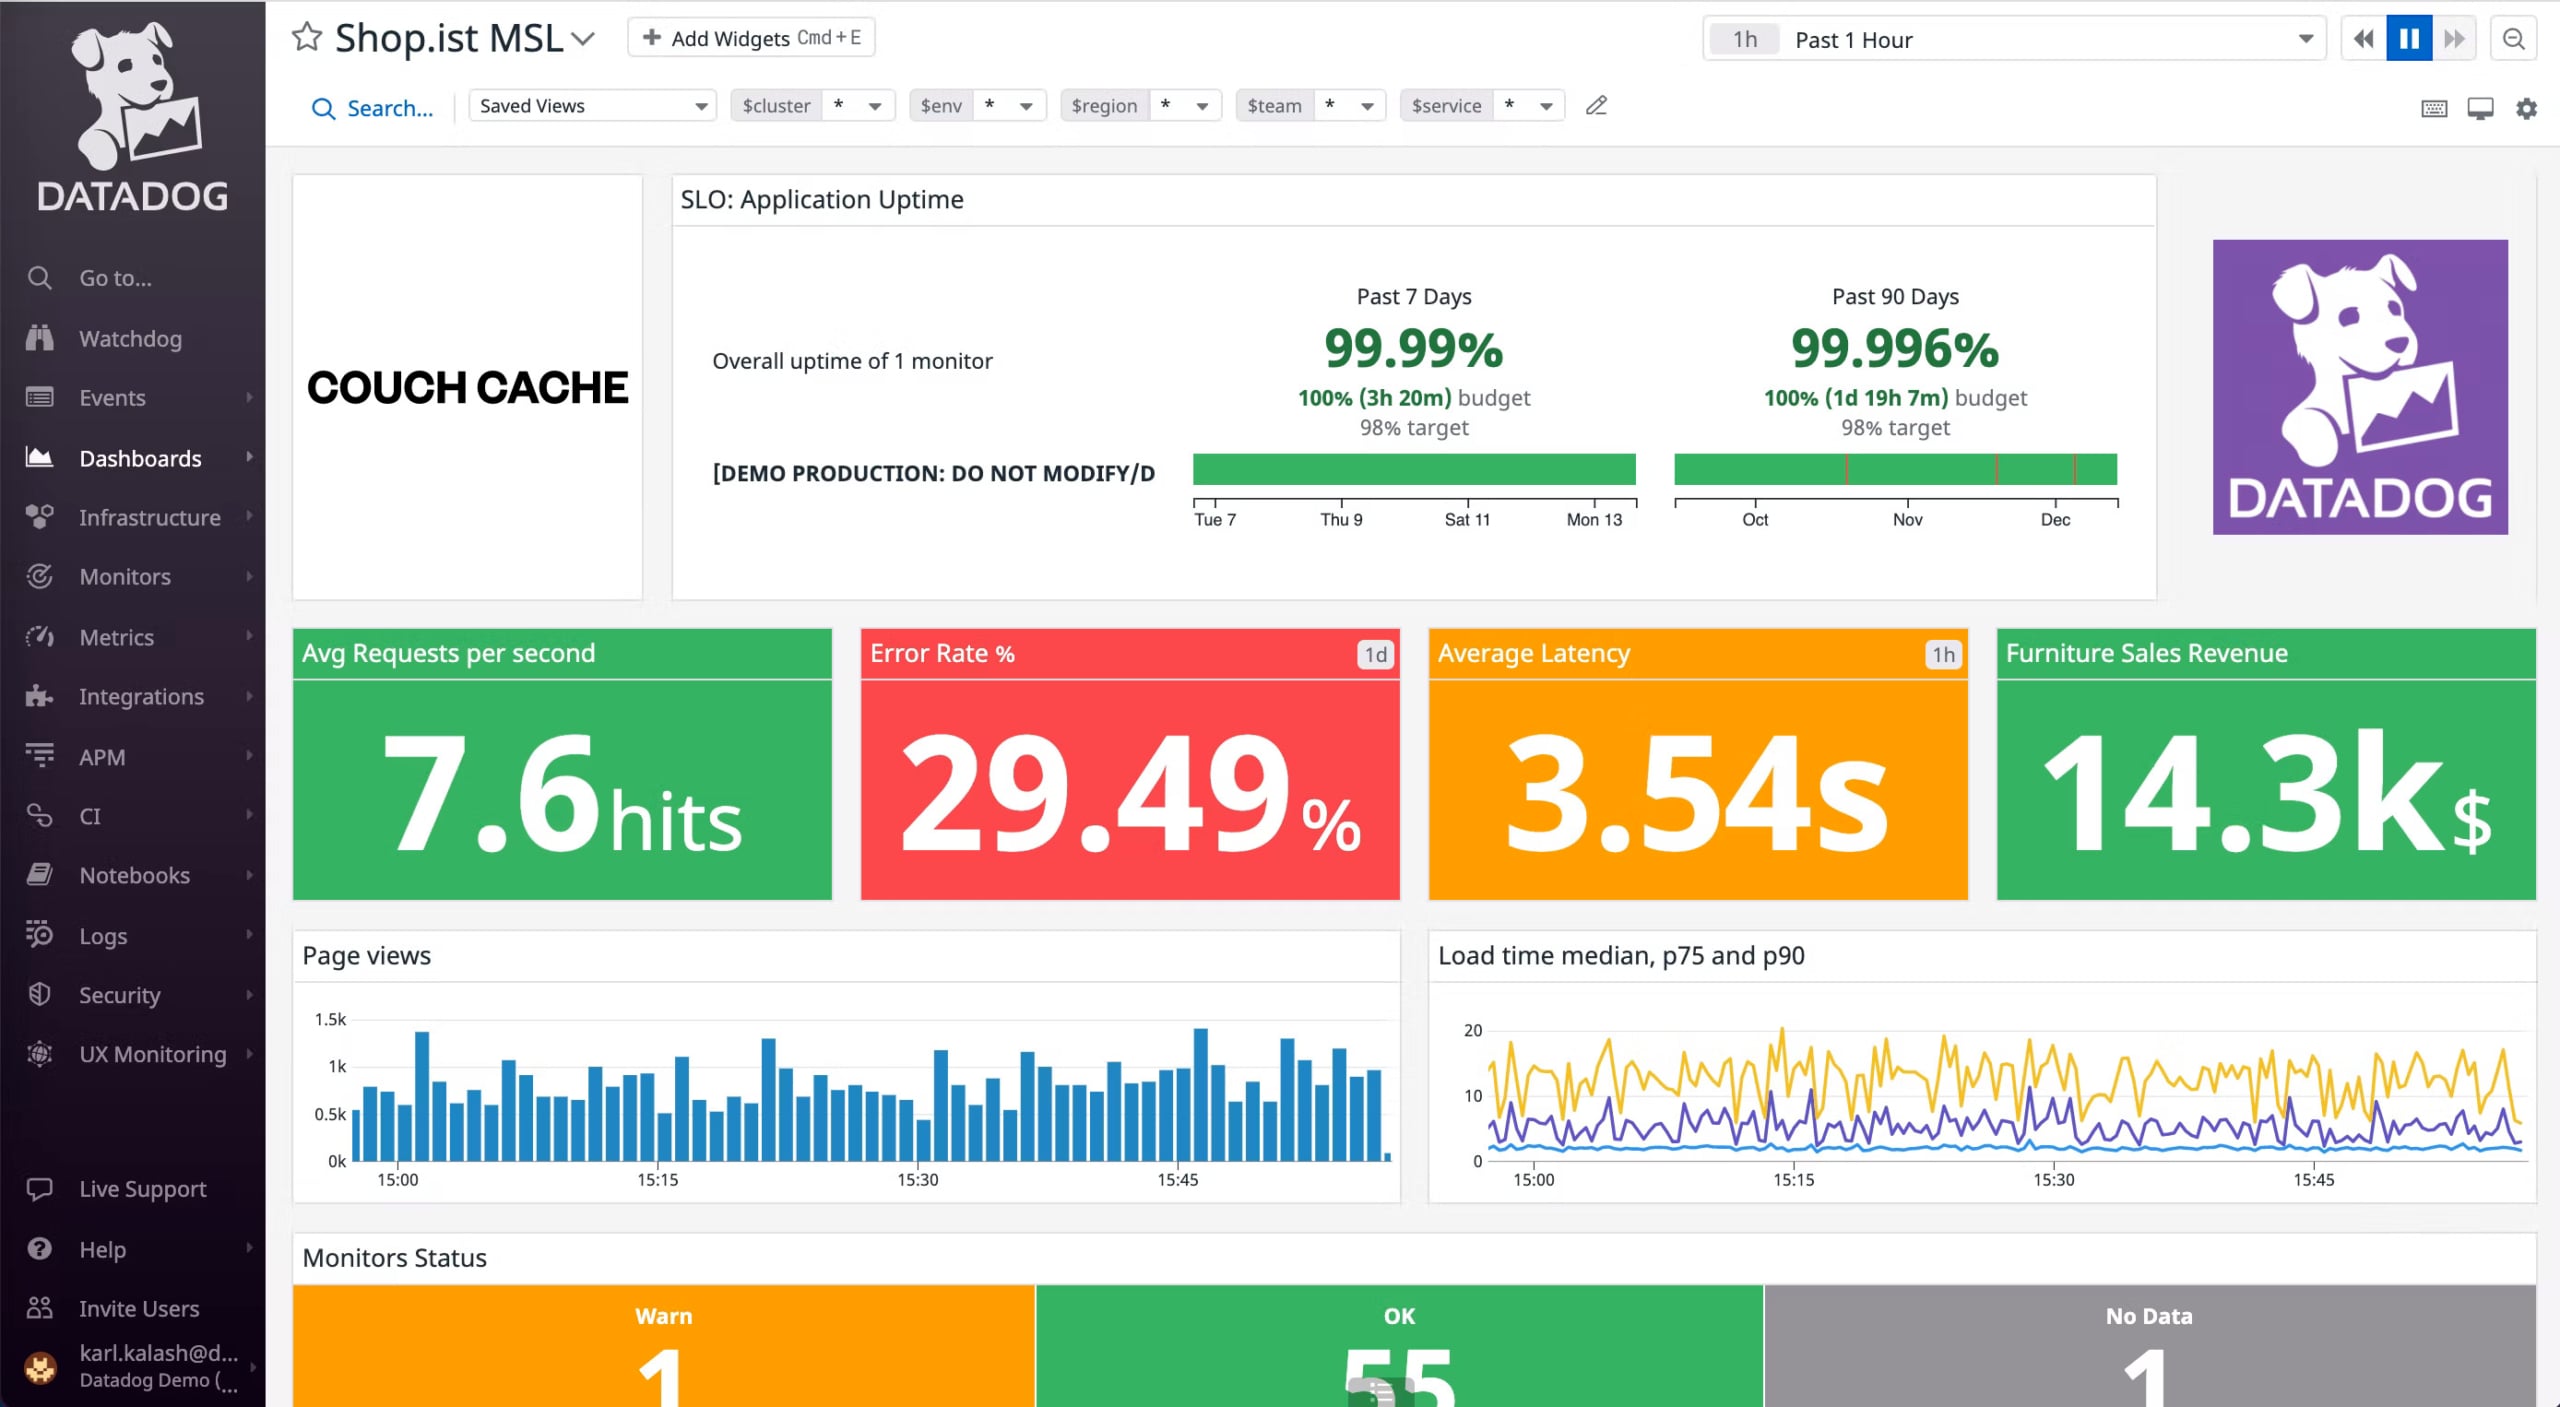
Datadog is an all-in-one SaaS-based monitoring tool developed by Olivier Pomel and Alexis Lê-Quôc in 2010. It helps collect data, monitor applications, detect issues faster, and generate alerts on noticing performance issues.
Why do we recommend it?
We tested Datadog’s capabilities in a sandbox environment and were particularly impressed with its all-in-one SaaS-based features. From IT infrastructure monitoring to bug reporting, the tool provides exceptional visibility across applications and networks, proving its claims true.
With so many components in a business, it gets difficult for employees to keep track of each app and monitor its performance. However, Datadog is the best solution for your problem in this case. With the help of Datadog, companies gain access to better visibility on their applications and networks.
Further, most businesses use the tool to collect data from cloud services, containers, and other sources and monitor, visualize and troubleshoot issues. It automatically collects logs and generates alerts on finding anything suspicious.
Its services are not limited to only IT infrastructure monitoring but also cover other areas, including Application performance, network monitoring, server monitoring, serverless microservices tracking, incident management, bug reporting, and log management.
Further, you can integrate 450+ applications with the tool and deliver exceptional monitoring capabilities. Today, companies of all sizes, including Peloton, Whole Foods, Samsung, 21st Century Fox, and HashiCorp, use Datadog to gain deeper visibility into high-scale IT infrastructure and deliver accurate results.
Who is it recommended for?
Datadog is a versatile solution suitable for IT operations teams and developers who need a comprehensive tool for monitoring and security. With the ability to integrate 450+ applications, it offers unparalleled monitoring capabilities, making it ideal for companies looking to gain deeper insights into high-scale IT infrastructure.
If your IT operations team or developers are looking for a monitoring and security tool that visualizes data about different applications, servers, and networks in real-time, go for Datadog.
Graphite vs Datadog: Key Features Comparison
| Graphite | Datadog |
|---|---|
|
|
Graphite vs Datadog: Head-to-Head Comparison
Datadog is a system monitoring tool whereas Graphite is a graphing tool that helps monitor time-series data. Both tools differ in terms of capabilities and are beneficial to the organization in different ways. Let us compare the two monitoring tools on a various basis, including:
| Graphite | Datadog | |
|---|---|---|
| Data Types | With Graphite, you can display any type of data in a time-series format. For example, you can display all the information related to CPU usage in the form of graphs or hard disk performance second by second using this tool. One can better understand the performance by identifying the spikes and variations. If you want to know how your system is performing in a graphical form, go for Graphite. | Datadog helps display all the information in the form of graphs and charts as per your choice. It is another great monitoring tool that provides real-time information on the applications and devices in the network. Unlike Graphite, it is not limited to only time-series format and can be represented in different forms. |
| Deployment | Graphite is a free-to-use monitoring tool that can run on Docker containers, Unix, Linux, and macOS. Users can also download its source code (from the GitHub repository), modify it, and use it across cloud and on-premise environments. | Datadog is available as a SaaS package, but you can deploy it anywhere. Also, it provides enough storage space for data and an excellent monitoring service. |
| Ease of Use | Graphite includes three main components, i.e., carbon (receives and transfers time-series data to Whisper), Whisper (stores data), and Graphite User Interface (displays the stored information) that need to be installed separately. It is easy to use the tool but requires a certain amount of technical skill and experience. | Datadog, on the other hand, is an all-in-one platform that involves a few technical roadblocks. Rest, the tool is quick to install and easy to use. |
| Functionality | Being a graphical monitoring tool, the role of Graphite is to only display the received information in a time-series format to the client. It does not collect any information from the individual systems. | Datadog, on the other hand, collects information from various sources and endpoints, analyzes it, and notifies the client on observing any deviation. Both platforms have individual roles yet are beneficial in different ways. So, when choosing between the two, make sure to opt for the one that suits your requirement. |
| Automation | Graphite automates the data receiving and displaying process. It automatically analyzes the received information and displays it in graphical form for better understanding and decision-making. | Datadog supports comprehensive automation features that help collect and analyze data faster without any manual work. Your employees have to no longer manually collect data from different sources and analyze every detail to conclude and form a strategy. The automation feature performs all the manual work related to collection and analysis. Further, it automatically creates alerts and notifies users in case of deviation. As a result, the automation feature supported by the Datadog platform helps businesses address major issues faster. |
| System Interface | Graphite’s user interface isn’t straightforward and uses APIs to allow other interfaces to use Graphite as a backend. It provides a composer that helps select and displays templates from different data sources in the Graphite web system. You can display these templates as images, CSV files, XML, or JSON formats. | In the case of Datadog, they provide a dashboard that instantly creates a set format and displays all the graphs and data on screens. It also supports APIs, in case you want to start from scratch. |
| Visualization | People find it easy to feed data into Graphite for visualization. Also, it is a self-hosted tool that provides automated feedback on the application’s performance. Another advantage of choosing Graphite is it supports a long list of integration and third-party tools. Another point of difference one must keep note of is that Graphite helps display different templates in images, CSV files, XML, or JSON formats. Whereas, Datadog represents all the collected data in the form of graphs and charts. | Datadog, on the other hand, collects, stores, and visualizes log data to help businesses quickly detect errors and troubleshoot them. It enables businesses to maintain and monitor performance. Further, it is not only limited to visualization but also supports customization and dashboard editing features. |
| Supports | Graphite provides documentation and StackExchange Community for Support | Datadog offers chat, email, and phone options for support |
| Pricing | Graphite is free-to-use but also supports seven paid plans for hosted versions. The basic plan of the Graphite tool offers ten alerts, while the premium plan offers a 250 alerts option. | Datadog, on the other hand, supports 12 modules. The infrastructure plan is closest to Graphite and is available for free for the first five hosts. Its Enterprise plan is the costly one and includes 100+ hosts. Also, one can try the 14-day free trial to gain benefits. |
Both the tools offer good service in exchange for the money. Compare their features and look for the business requirements when making a final call.
Graphite vs Datadog – The Verdict
When using technology to run a business, finding out errors and mistakes without proper tools can be a challenging task for several enterprises. You might miss minor errors while performing manual tasks.
It is best to invest in monitoring tools in this case. Further, these tools save time and enable businesses to make better-informed decisions.
In this post, we have compared Graphite and Datadog. Graphite and Datadog are popular monitoring tools available in the market but differ in functionality.
Graphite is a data stream graphing package used by most enterprises for checking throughput rates and temperature reports. It is a free, open-source tool that can be used by anyone.
The main role of Graphite is to display the received data in a time-series format representing second-by-second information for better understanding and decision-making.
If you are looking for a monitoring tool that provides better visibility into the collected data, generates alerts, and notifies users instantly on noticing anything suspicious, go for Datadog.
As stated above, it provides a wide range of services apart from infrastructure monitoring and supports integration with 450+ applications.
Both the monitoring tools vary in functions yet are beneficial in many ways. They do not directly compete but complement each other. Their pricing plans also differ in many ways. Hence, compare their above-listed features and make sure to look at your business requirements before concluding.
