Azure, the cloud computing service from Microsoft, can significantly enhance your organization’s productivity, collaboration, and ease of use. However, just like any other tool, it has to be well-managed and monitored to ensure that it is up and running at all times in optimal health.
Here is our list of the best Azure monitoring tools:
- SolarWinds Hybrid Cloud Observability – FREE TRIAL Monitors on-site assets and cloud platforms, presenting them as a unified system, and provides maps of networks and application dependencies and it offers analysis utilities. Install it on Windows Server, AWS, and Azure. Get a 30-day free trial.
- ManageEngine ADAudit Plus – FREE TRIAL Protects Active Directory on Windows Server, Azure, and AWS, also performs file integrity monitoring and user behavior analysis. Runs on Windows Server, Azure, and AWS. Start a 30-day free trial.
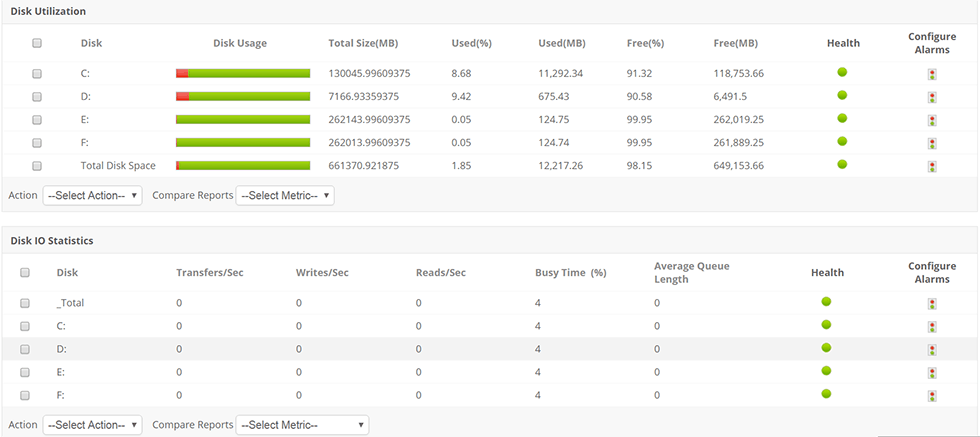
- Site24x7 Infrastructure Monitoring – FREE TRIAL Stay on top of the performance and issues and outages in your Azure monitoring system by giving you the metrics and insights you need to address problems proactively. Start a 30-day free trial.
- ManageEngine Applications Manager – FREE TRIAL Proactively monitors all your Azure resources and gives the information needed about their performance, so you can make the necessary tweaks to improve their productivity. Start a 30-day free trial.
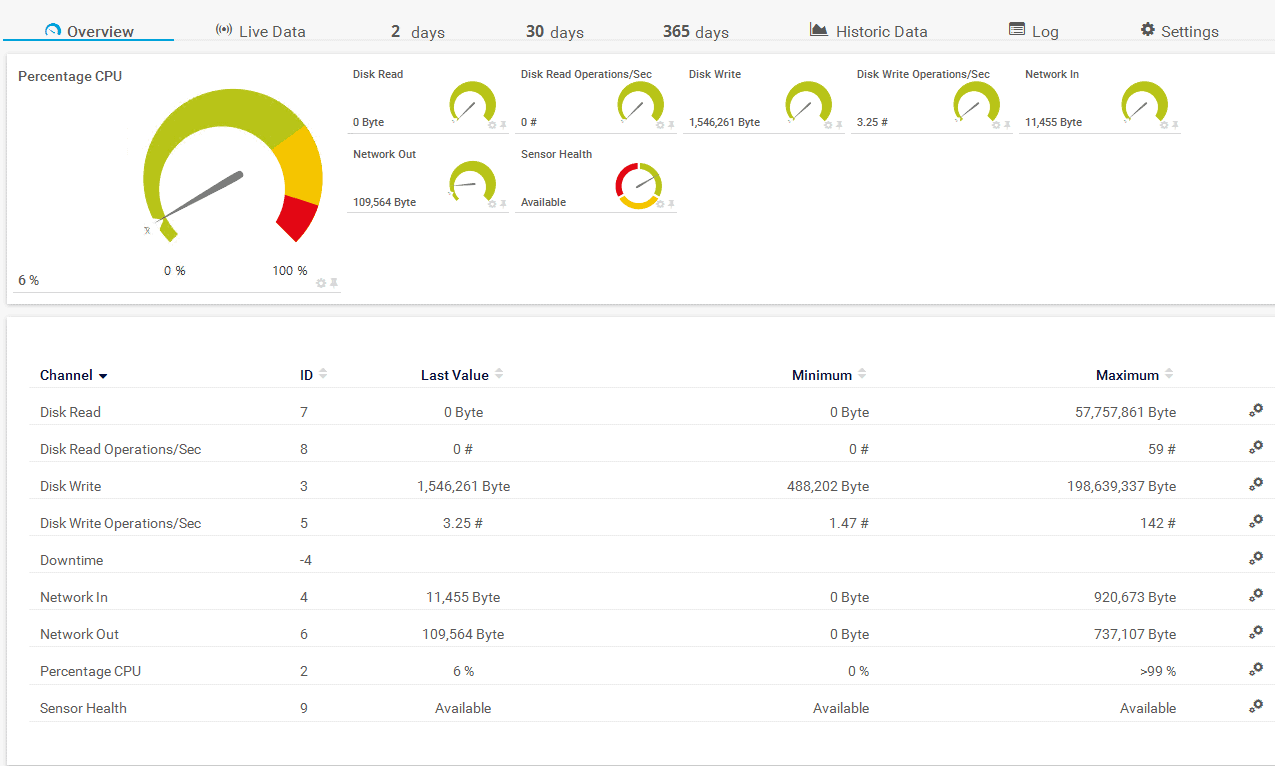
- Paessler PRTG Azure Monitoring – FREE TRIAL Powerful tool that analyzes your Azure platform, identifies any anomalies, and makes appropriate recommendations, so you can fix them before it affects your security or reputation. Start a 30-day free trial.
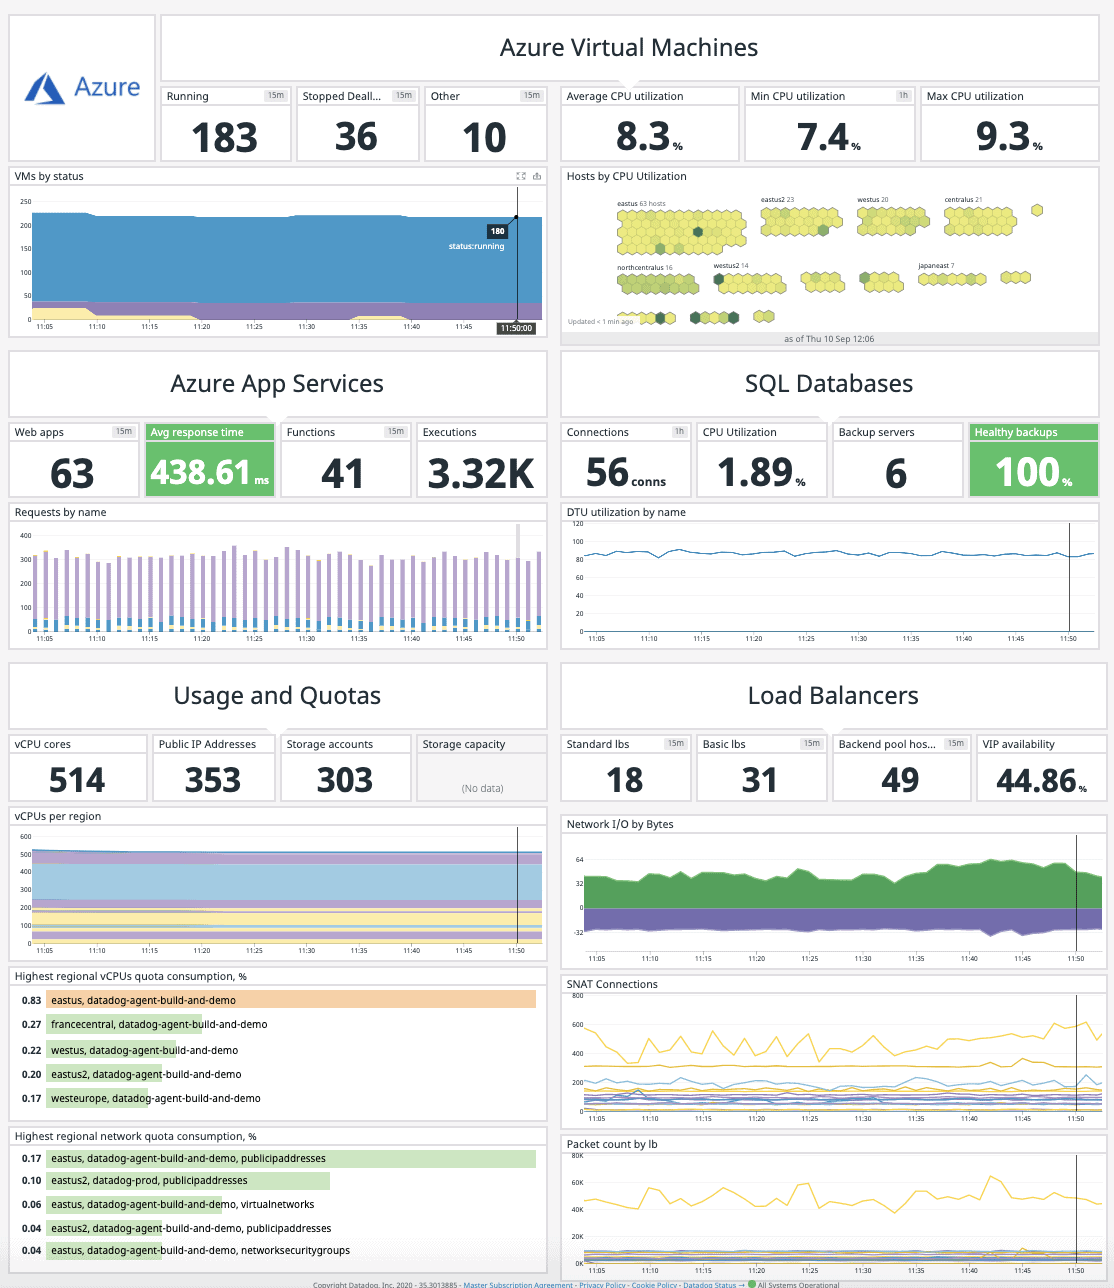
- Datadog Integrates well with DevOps workflows and pipelines to give detailed insights into the performance of your Azure platform and the applications hosted on it. This helps to quickly and efficiently catch the threats to your organization.
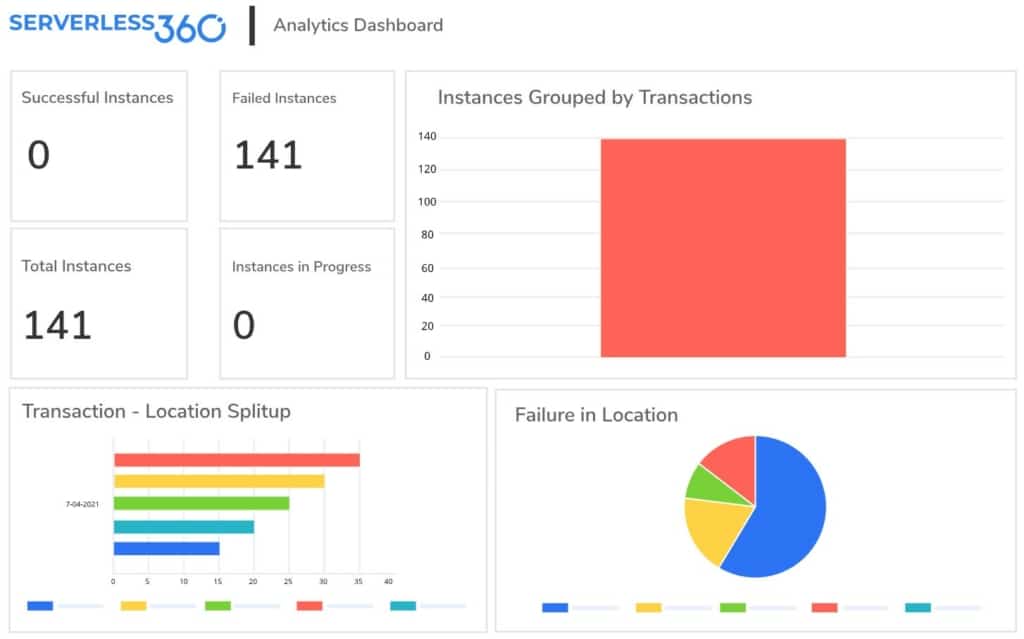
- Serverless360 Groups services into logical applications, creates a cross-platform dependency map, implements distributed tracing, and logs Azure resource usage. Implemented as a SaaS platform, a virtual machine, or an Azure service.
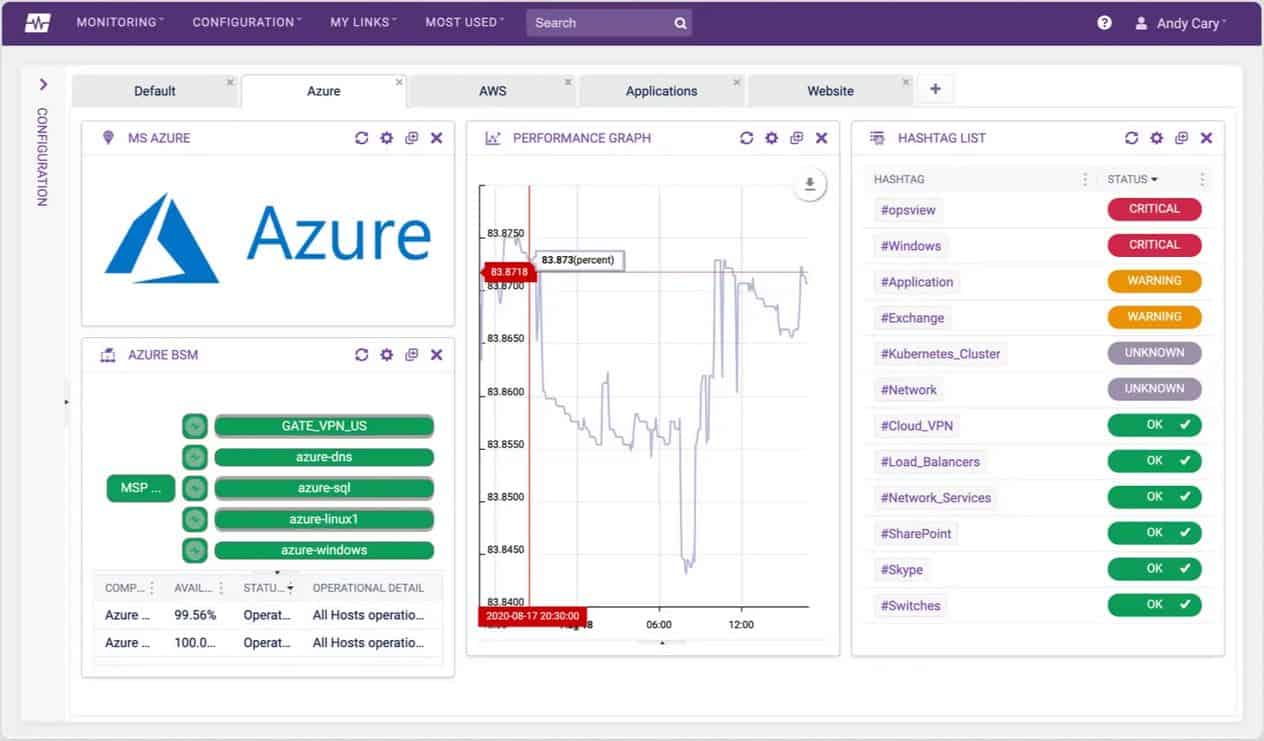
- OpsView Monitors your Azure environment and gives all the metrics you need to monitor the performance of your cloud applications.
- ScienceLogic Gives a clear and concise view of your entire Azure infrastructure and its services and applications.
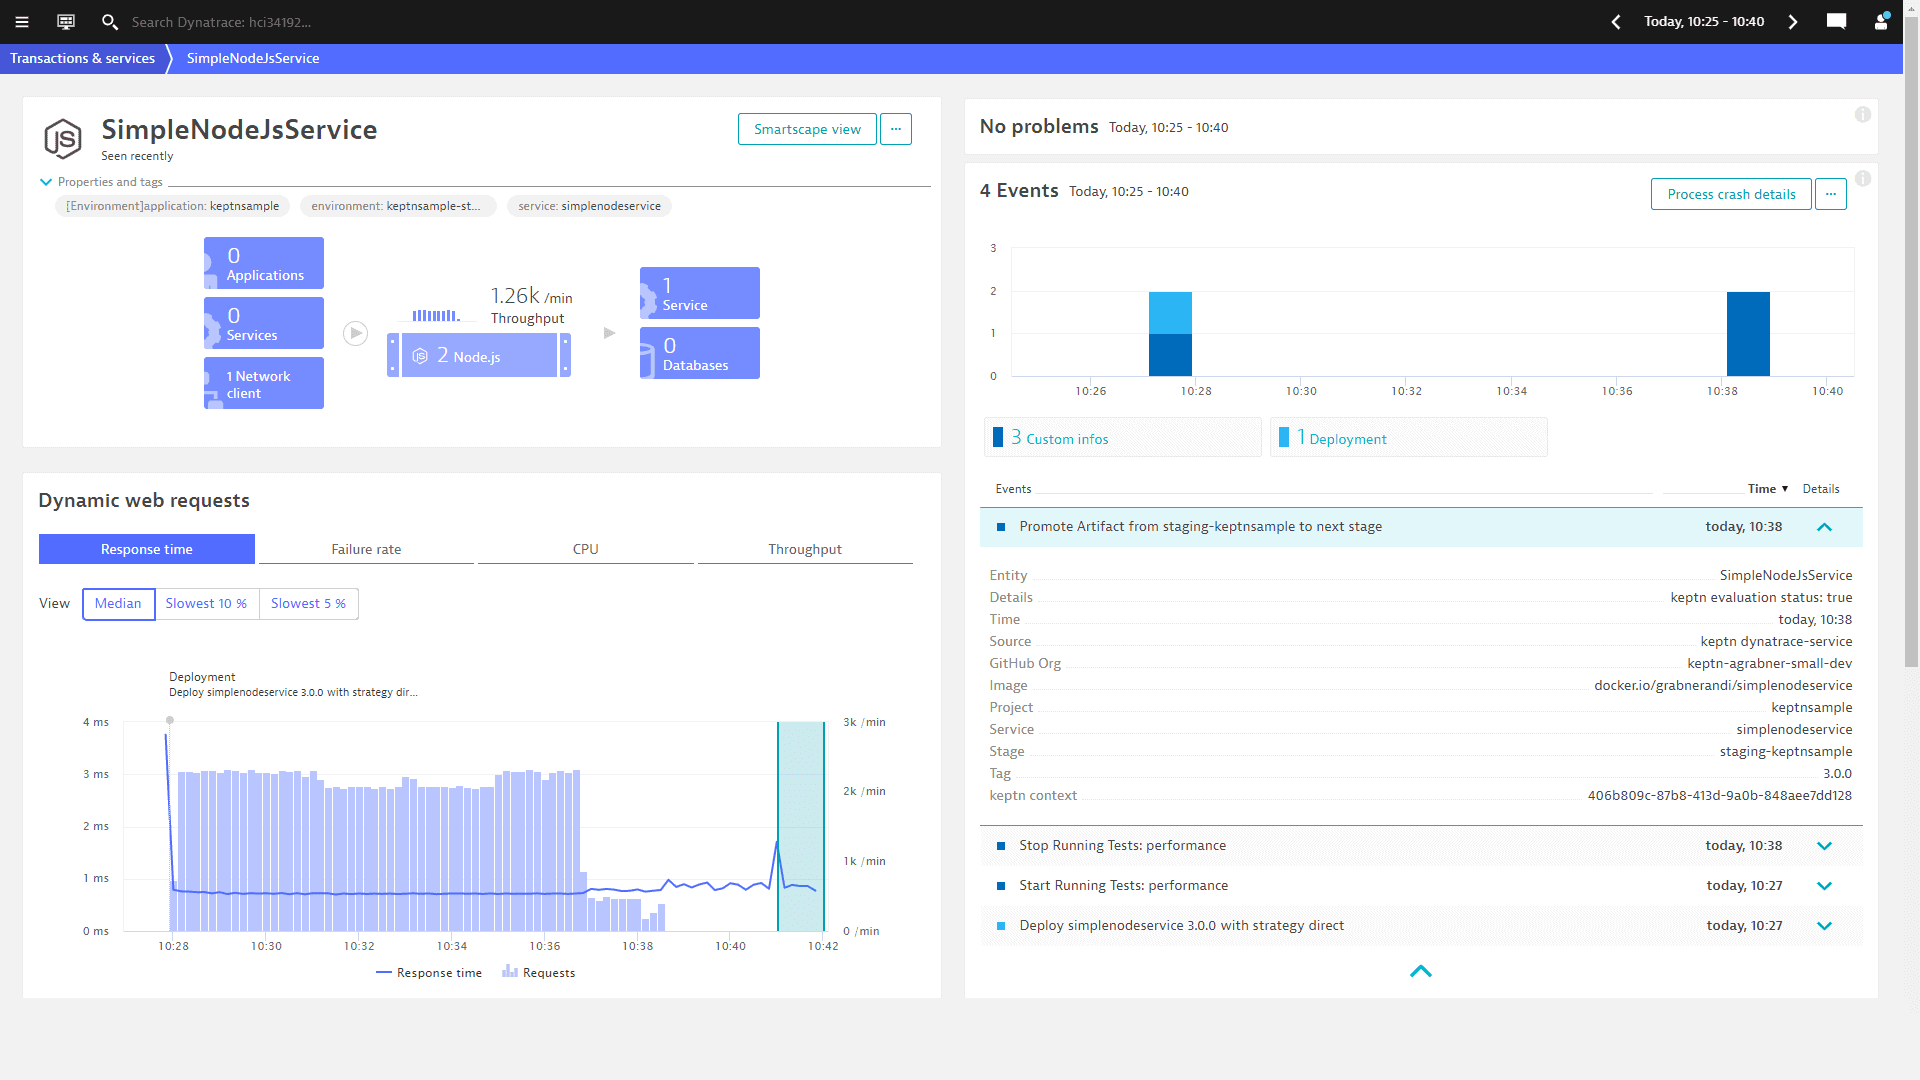
- Dynatrace Fully automated Azure monitoring tool that uses advanced AI capabilities to analyze your Azure environment and accordingly makes appropriate recommendations to improve its overall efficiency.
- AppDynamics Part of Cisco, comes with readily available tools for rapidly troubleshooting the bottlenecks in the Azure environment and optimizing the performance of applications that run on it.
- LogicMonitor Integrates well with the Azure platform to gather metrics for detailed analysis and insights.
There are tons of things that can go wrong with the Azure platform, with some of the common problems being:
- Security vulnerabilities
- Misconfiguration
- Shared model
- Encryption of data, and more.
You need the right Azure monitoring tools to ensure that the above possible Azure problems don’t impact your organization. But this is easier said than done given the vast number of Azure monitoring tools available today.
Our methodology for selecting Azure monitoring tools
We reviewed the market for Azure monitoring tools and analyzed software based on the following criteria:
- Monitoring Capabilities: How comprehensive is the monitoring? Does it cover infrastructure health, application performance, logs, and other relevant aspects of an Azure environment?
- Usability and Efficiency: How easy is it to set up and use the tool, especially for organizations with limited IT resources?
- Integration and Scalability: Does the tool integrate seamlessly with your existing monitoring infrastructure and DevOps workflows?
- Vendor Reputation and Support: What is the reputation of the vendor in terms of product quality and customer support?
The Best Azure Monitoring Tools
To ease this process, let’s dive deep into the features and pricing of each of some of the best tools that can monitor the performance and availability of Azure.
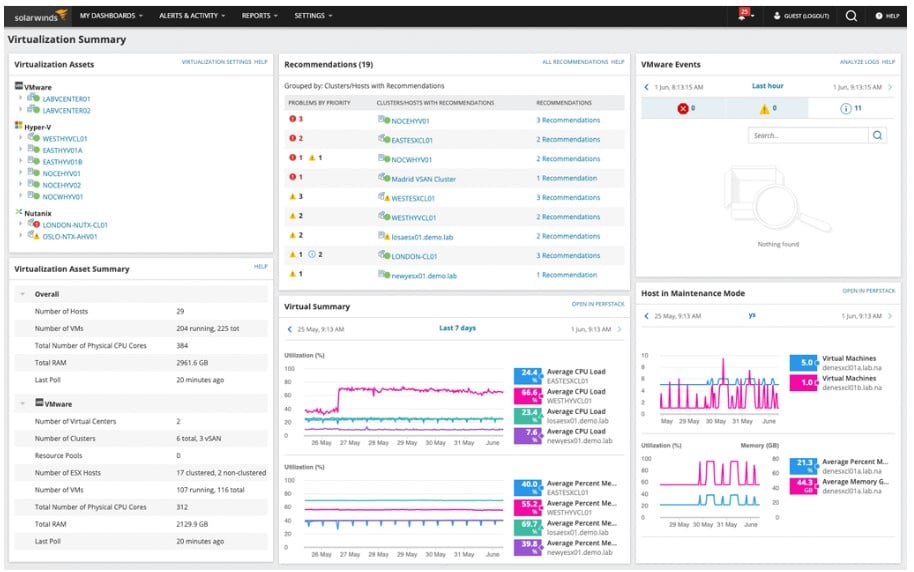
1. SolarWinds Hybrid Cloud Observability – FREE TRIAL
In a recent assessment, SolarWinds Hybrid Cloud Observability and other SolarWinds products compared favorably to the monitoring tools of other major system providers. Get a copy of the 2022 GigaOm Radar for Cloud Observability Solutions Report at the SolarWinds website.
Key Features:
- Automated Discovery and Mapping: Discovers your Azure resources (VMs, containers, databases) and automatically maps their interconnections, thereby providing a clear understanding of your Azure environment’s topology.
- Application Dependency Mapping: Identifies how different applications and services in Azure rely on each other. This helps pinpoint issues that originate within an application stack and how they might affect user experience.
- Performance Analysis: Offers advanced analytical tools that correlate performance data across different Azure services and identify bottlenecks or inefficiencies impacting application delivery.
- End-to-End Path Tracking: Provides a visual representation of the network path between users and Azure applications.
- Real-Time and Historical Performance Tracking: Offers live performance dashboards and historical data analysis tools for comprehensive performance monitoring of your Azure resources.
- Alerting and Notification: Provides customizable alerts that notify you of evolving performance issues within your Azure environment, allowing for proactive problem resolution.
Why Do We Recommend It?
SolarWinds Hybrid Cloud Observability stands out as a compelling choice for organizations seeking a comprehensive Azure monitoring tool. It transcends basic monitoring by offering visibility across your entire cloud landscape, including other platforms like GCP and AWS. This unified view is crucial for managing hybrid cloud environments.
Who Is It Recommended For?
It is recommended for organizations with the budget and technical resources to maximize its potential, particularly those managing complex hybrid cloud environments with a significant Azure footprint.
Pros:
- Root Cause Analysis: Helps pinpoint the root cause of performance problems within your Azure environment, saving time troubleshooting and resolving issues faster.
- Cross-Platform Visibility: Tracks activities not only on Azure, but also on other cloud platforms like Google Cloud Platform and AWS. This provides a unified view of your entire cloud landscape.
- AI-Powered Anomaly Detection and Root Cause Analysis: Quickly pinpoint and address performance problems within your Azure environment.
- User Experience Monitoring: Provides insights into individual user performance within Azure applications. This allows you to identify and address issues affecting specific users or user groups.
Cons:
- Cost: Hybrid Cloud Observability is a paid solution, so factor in the pricing structure when evaluating if it aligns with your budget.
Cost:
- Essentials – from $5 per node per month
- Advanced – from $9 per node per month
Get a 30-day free trial.
2. ManageEngine ADAudit Plus – FREE TRIAL
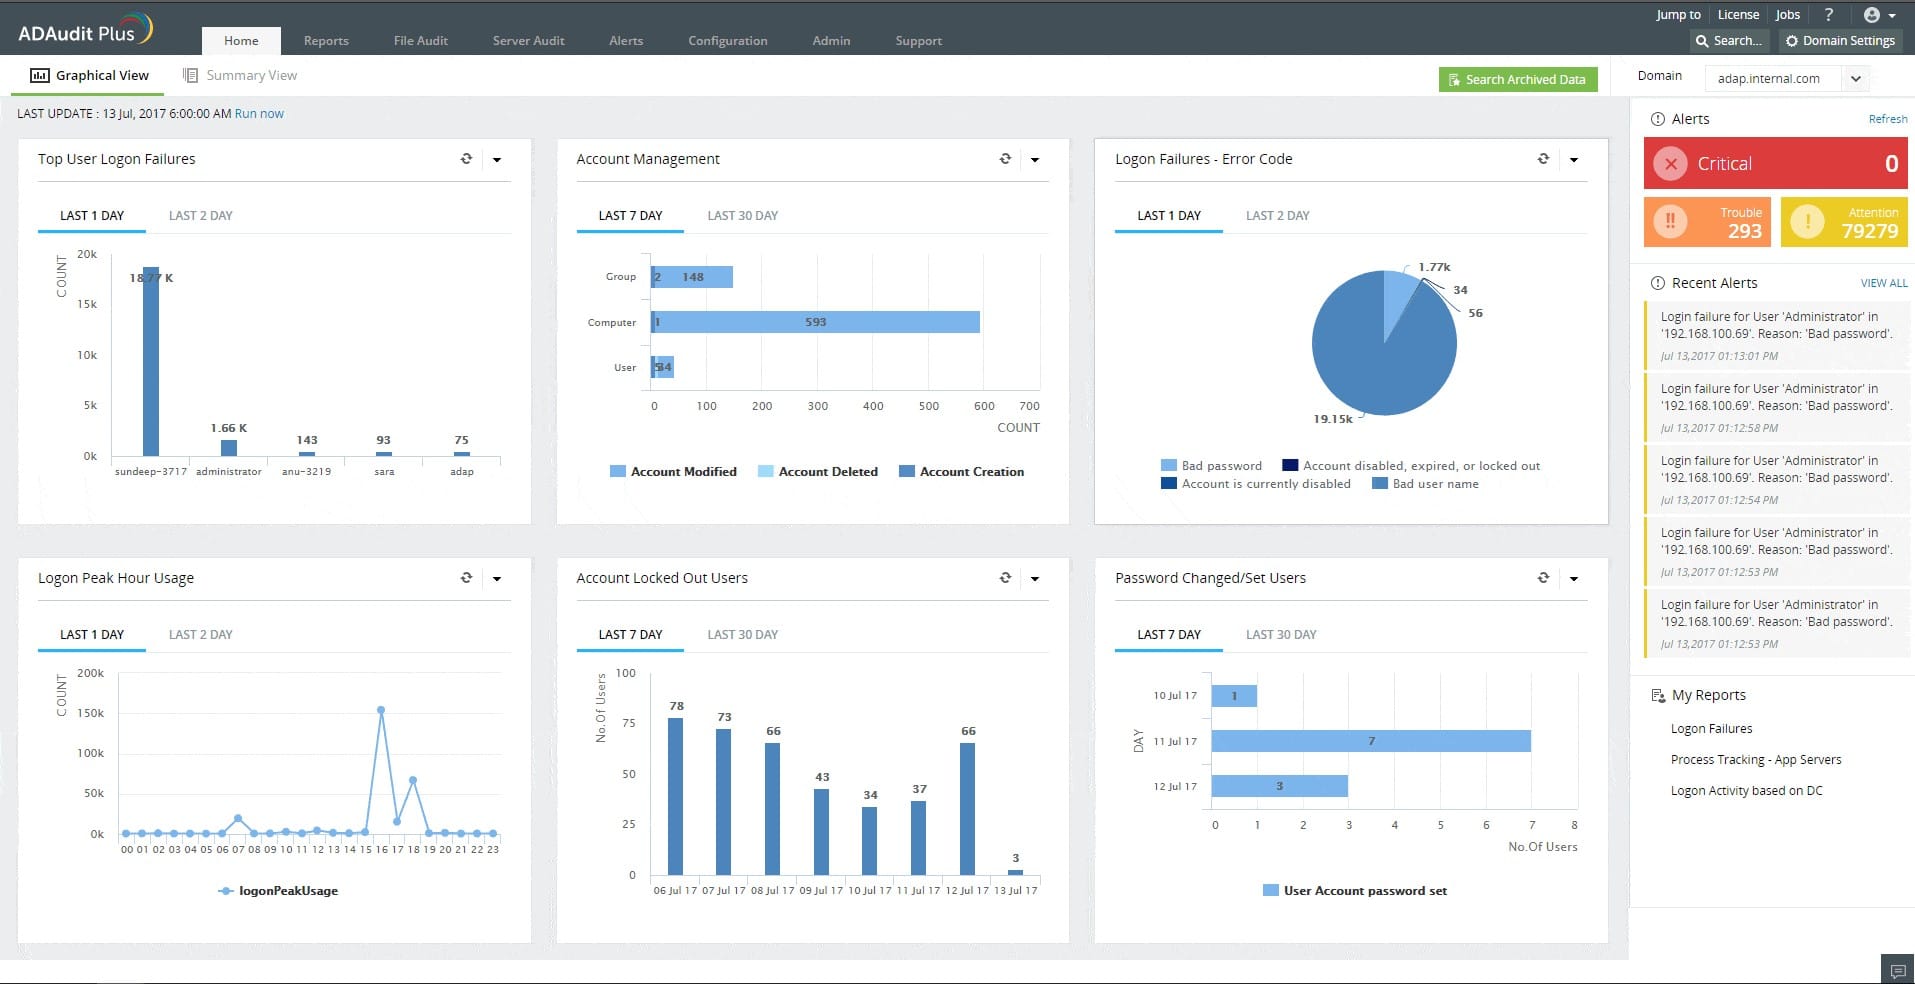
ManageEngine ADAudit Plus operates on Active Directory instances on all platforms, including Azure. The tool protects AD against unauthorized changes and tracks the activities of users, identifying file access per user account as listed in Active Directory.
Key Features:
- User Activity Monitoring: Tracks user activities across workstations, including those potentially accessing Azure resources. This helps identify suspicious activity or potential security breaches.
- In-Depth File Access Monitoring: Tracks file access activities on servers, including file servers and cloud accounts like Azure and AWS storage. This provides visibility into who accessed what files and when.
- Azure and AWS Cloud Storage Monitoring: Specifically logs file access events on Azure and AWS accounts, providing detailed insights into user interactions with your cloud storage resources.
- Integration Capabilities: Integrates seamlessly with other ManageEngine products and various third-party tools, enhancing overall IT management and security posture.
Why Do We Recommend It?
ManageEngine ADAudit Plus is recommended for its extensive auditing and reporting capabilities tailored specifically for Azure AD. The tool provides deep visibility into user activities, security configurations, and changes within the Azure AD environment, ensuring robust security and compliance management.
Who Is It Recommended For?
It is recommended for organizations that heavily rely on Azure AD for identity and access management, such as medium to large enterprises, government agencies, and educational institutions, and IT security teams who need to ensure regulatory compliance and maintain stringent security standards.
Pros:
- Detailed Insights: Provides deep insights into login activities, user behavior, and administrative changes, helping in proactive security management.
- Compliance Management: Helps organizations meet regulatory compliance requirements by providing audit trails and predefined compliance reports.
- Free Version Available: A free edition allows activity monitoring on up to 25 workstations, making it suitable for smaller organizations or those testing the tool before committing.
- Cost-Effective Option: The free tier makes it an attractive option for smaller organizations or those looking for a basic solution to monitor user activity and file access on workstations and Azure storage.
Cons:
- Limited Scope: Focuses primarily on user activity and file access monitoring. It doesn’t offer comprehensive performance monitoring or health checks for other Azure services like VMs or databases.
- Potential Scalability Limitations: The free version’s 25-workstation limit might not be suitable for larger organizations. Upgrading to paid plans unlocks increased monitoring capacity but adds cost.
Cost:
- Free: $0
- Standard: From $595
- Professional: From $945
Get a 30-day free trial.
3. Site24x7 Infrastructure Monitoring – FREE TRIAL
Site24x7 Infrastructure Monitoring can give all the insights you need to stay on top of the entire cloud infrastructure. It also makes it easy to manage your cloud deployments while its AI-driven predictions ensure that you handle issues before they become problems.
Key Features:
- Unified Cloud Monitoring: Tracks and manages resources across private, public, and hybrid cloud environments, including Azure.
- Azure-Specific Monitoring: Analyzes performance trends of native Azure services like VMs, Kubernetes clusters, PaaS offerings, and more.
- Unified Dashboard: Features a unified dashboard that presents data from various Azure services in one place, offering a holistic view of the infrastructure’s health and performance.
- Automated Incident Remediation: Automates specific remediation tasks for individual Azure resources when issues arise. This reduces manual intervention and ensures faster resolution times.
- Security Monitoring: Uncovers malicious activities within your Azure environment at the earliest stages, safeguarding your cloud resources from potential threats.
- In-Depth Performance Monitoring: Its VM extensions provide system-level metrics like CPU, memory, and network usage for Windows and Linux VMs in Azure.
- Log Management: Collects logs from cloud-based applications in Azure and analyzes them with its log management tool.
Why Do We Recommend It?
Site24x7 Infrastructure Monitoring is recommended for its comprehensive and real-time monitoring capabilities across a wide range of Azure services. The platform offers a unified dashboard that consolidates data from various Azure resources, providing a holistic view of the infrastructure’s health and performance.
Who Is It Recommended For?
This monitoring tool is particularly recommended for SMB,, large enterprises, and MSPs who need a robust and scalable solution to monitor their Azure environments. It is also ideal for IT teams that require real-time insights and detailed reporting to manage their infrastructure proactively.
Pros:
- Extensive Extensibility: Offers over 100 plugin extensions, potentially including integrations with specific Azure services for even more granular monitoring capabilities.
- AI-Powered Optimization and Automation: Provides proactive insights and automates tasks to streamline Azure management and optimize performance.
- Integrations and API Support: Provides extensive integrations with other IT management tools and APIs for custom monitoring solutions, enhancing flexibility and extensibility.
- Advanced Analytics and Reporting: Offers advanced analytics and reporting capabilities, providing insights into performance trends and helping with capacity planning and optimization.
Cons:
- Pricing: A paid service. Evaluate the pricing structure to ensure it aligns with your budget.
- Complexity: The extensive feature set presents a steeper learning curve compared to basic Azure monitoring tools.
The starter pack is priced at $9/month/resource. The cost will increase as you add more services and resources. Start a 30-day free trial.
4. ManageEngine Applications Manager – FREE TRIAL
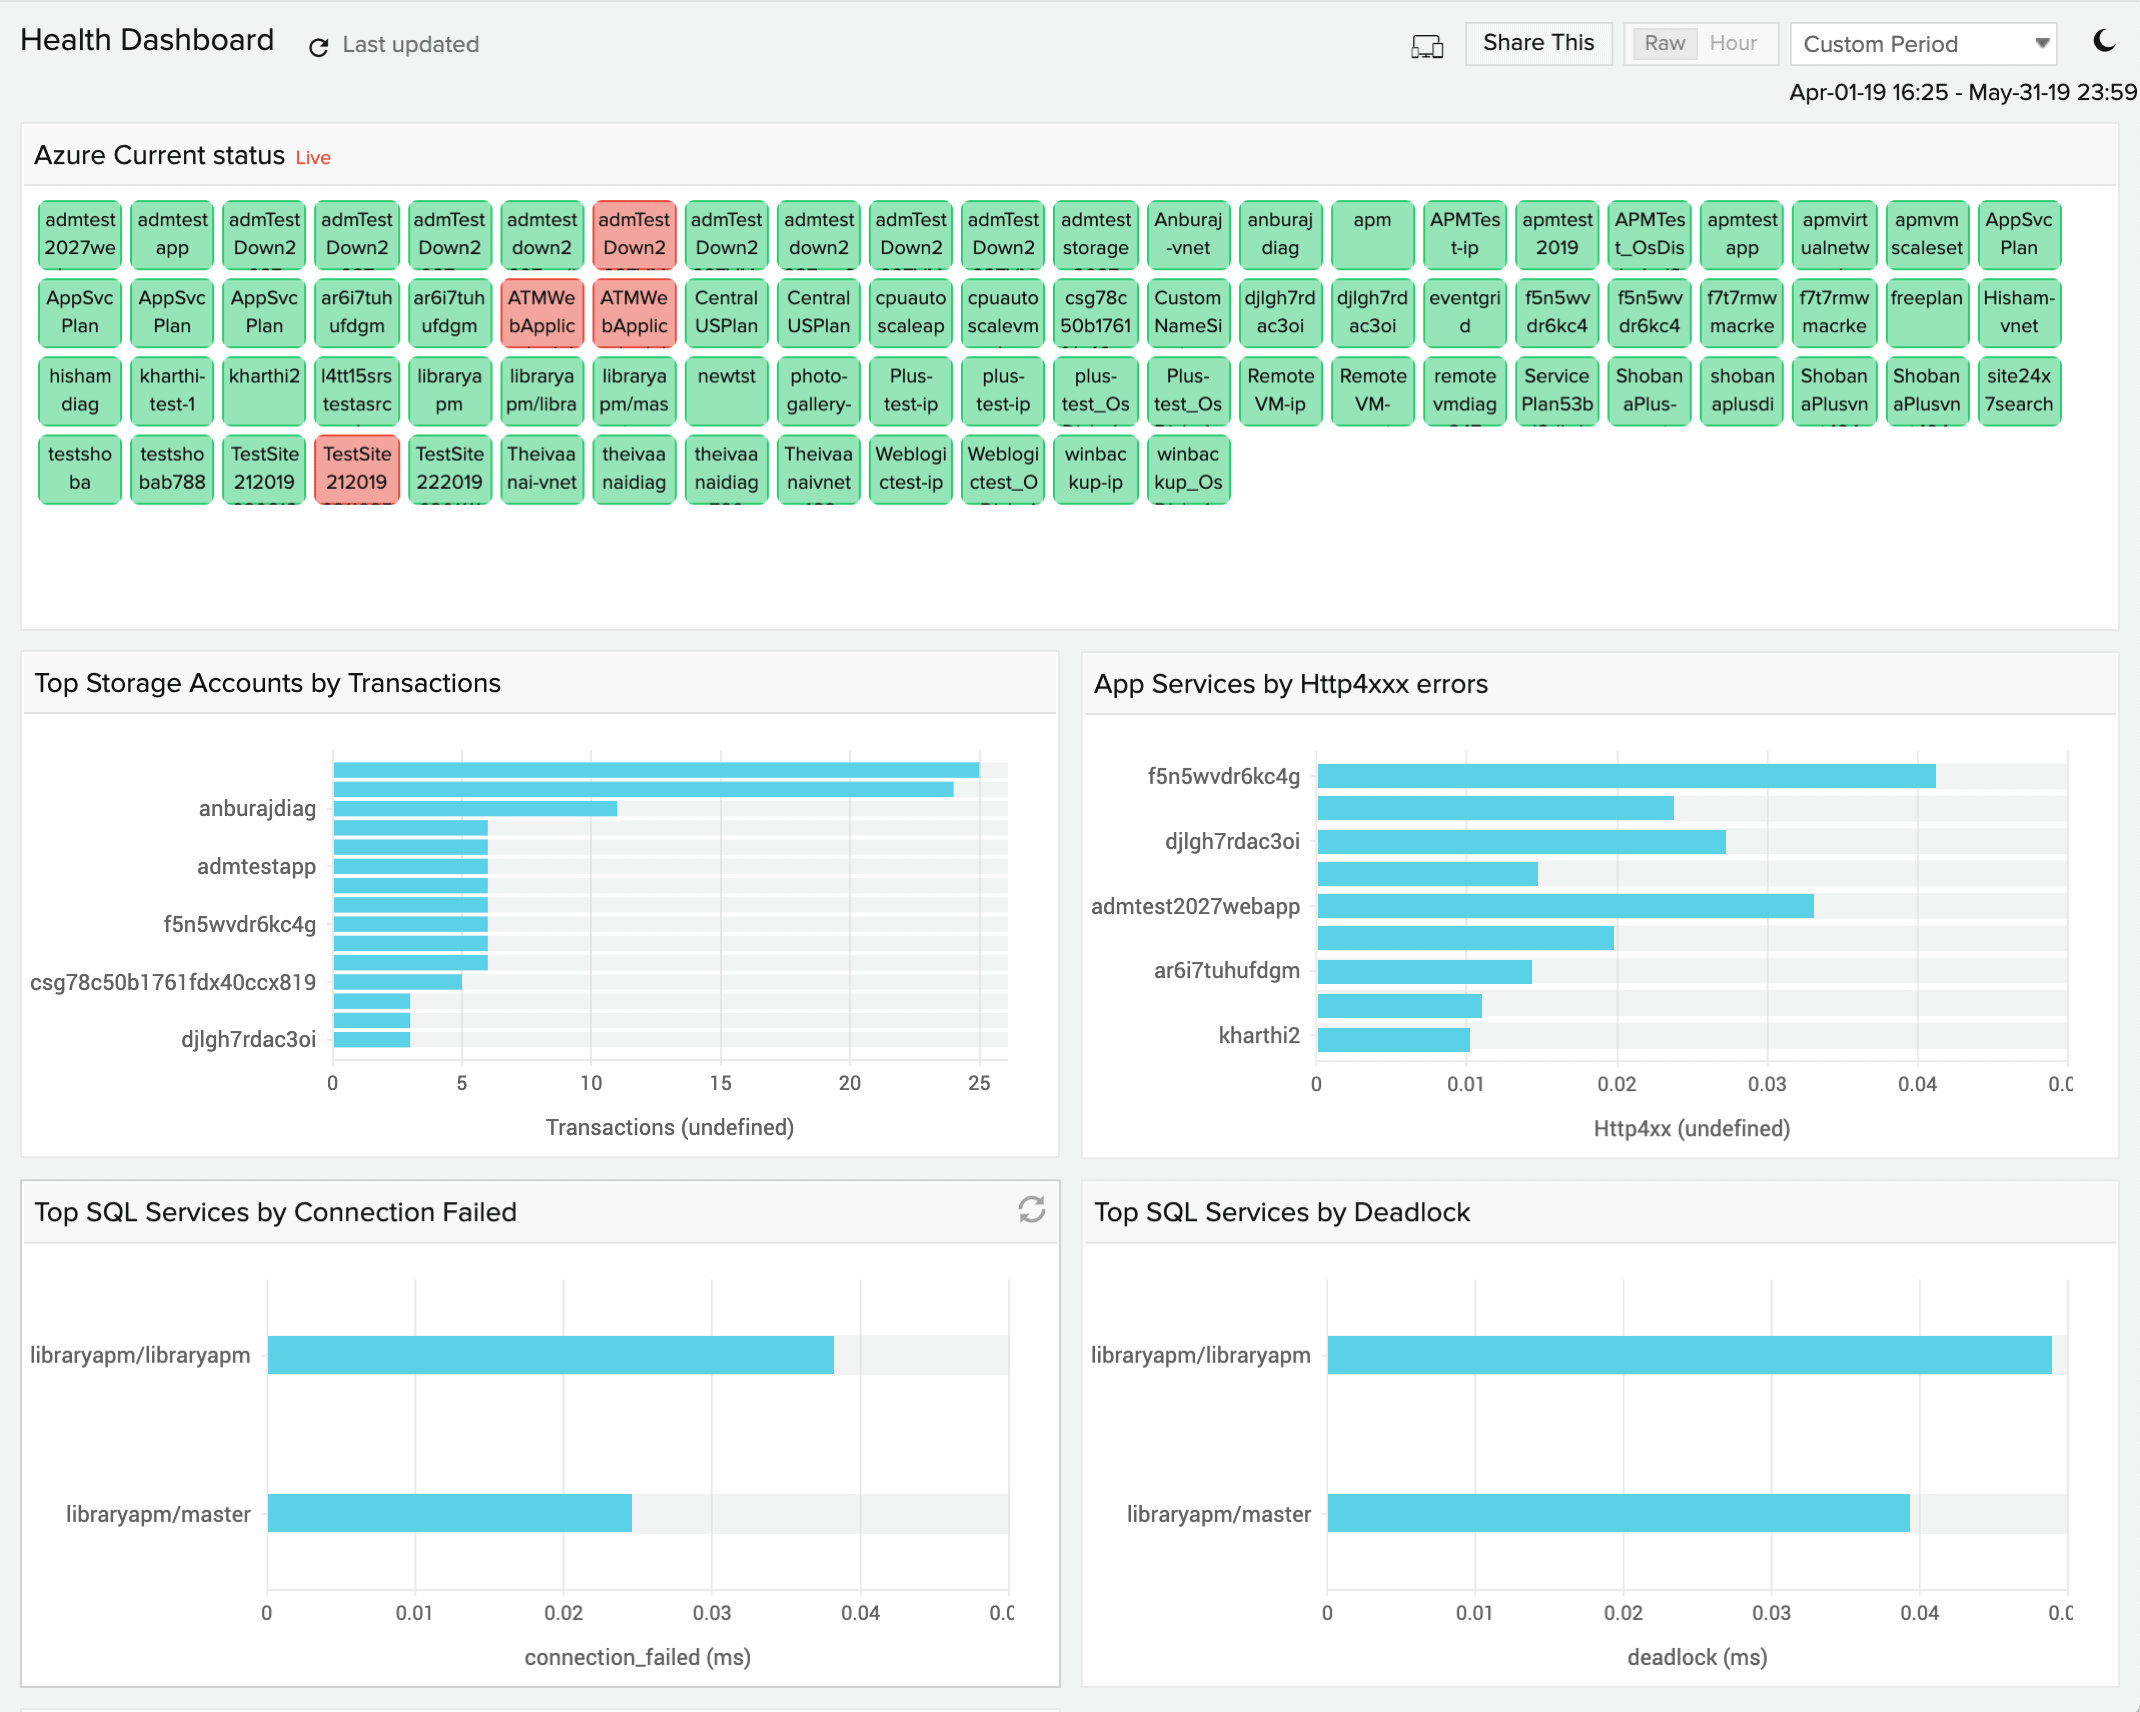
ManageEngine Applications Manager is an out-of-the-box monitoring solution for your Azure platform. It proactively monitors the KPIs of your Azure environment and aggregates the metrics to give you a comprehensive idea of your platform’s performance.
Key Features:
- Azure Insights: Provides insights into your Azure environment, helping you identify performance bottlenecks and potential issues.
- Alerting and Notification: Responds to critical events within your Azure resources by sending customizable alerts via SMS or email.
- Auto-Scaling and Cost Optimization: Helps you optimize your Azure resource utilization by automatically scaling resources up or down based on system load.
- Security Monitoring: Sends detailed information about potential threats and vulnerabilities within your Azure environment, allowing you to address security concerns before they become critical.
- Database Monitoring: Ensures continuous availability of your Azure databases by providing comprehensive monitoring and insights into their health and performance.
- Storage Monitoring: Offers deep visibility into your Azure storage accounts, enabling you to optimize storage utilization and identify potential issues.
Why Do We Recommend It
ManageEngine Applications Manager is recommended for its comprehensive and user-friendly monitoring capabilities that extend across a wide range of Azure services and infrastructure. It provides in-depth performance metrics, customizable dashboards, and detailed analytics, which are crucial for identifying and resolving performance bottlenecks efficiently.
Who Is It Recommended For?
ManageEngine Applications Manager is particularly recommended for medium to large enterprises that require robust monitoring solutions for complex and extensive Azure deployments. Organizations that already use other ManageEngine products will benefit from the seamless integration and unified monitoring capabilities.
Pros:
- Root Cause Analysis: Provides valuable data and pinpoints the root cause of issues, facilitating faster and more efficient problem resolution within your Azure environment.
- Automation and Scripting Support: Reduces manual intervention through the automation of routine monitoring tasks, resource utilization, and scripting for custom monitoring needs.
- Performance Baselines and Resource Allocation: Allows you to configure performance baselines for your Azure resources and identify instances of improper resource allocation.
Cons:
- Limited Focus on Azure: While offering valuable functionalities for Azure, ManageEngine Applications Manager is not exclusively designed for Azure monitoring.
- Pricing: ManageEngine Applications Manager is a paid service. Evaluate the pricing structure to ensure it aligns with your budget.
Click here to download a free trial version.
5. Paessler PRTG Azure Monitoring – FREE TRIAL
PRTG from Paessler is a sensor-based monitoring tool that monitors every aspect of your Azure platform and applications to give you powerful insights into their working and health, so you take the necessary steps proactively to get the most out of them.
Key Features:
- Simple Setup and Configuration: Requires minimal setup and configuration, saving time and effort compared to more complex monitoring tools.
- Sensor Customization: Existing PRTG sensors can be customized to monitor specific aspects of the Azure platform, offering flexibility in tailoring your monitoring needs.
- Resource Tracking and Discovery: Provides an easy way to keep track of your Azure resources and their usage with automatic discovery of new resources within your Azure environment.
- Extensive Monitoring Capabilities: Monitors a wide range of Azure resources (17 types) including SQL databases, websites, storage accounts, cloud apps, schedulers, service health, virtual machines, and more.
- Cost Monitoring: Includes a dedicated billing sensor to monitor your Azure spending and ensure you stay within budget.
Why Do We Recommend It?
PRTG’s strength lies in its ease of setup, minimal configuration, customizable approach, and ability to adapt existing sensors for specific Azure resource monitoring.
Who Is It Recommended For?
PRTG is best suited for SMBs or organizations with limited IT resources that value user-friendliness, customization, and don’t necessarily require the most advanced Azure-specific functionalities.
Pros:
- Easy to Use: User-friendly interface and minimal setup requirements make PRTG a good choice for organizations seeking a straightforward Azure monitoring solution.
- Detailed Metrics: Delivers in-depth information on specific metrics like CPU usage, database size, storage capacity, latency, availability, disk operations, downtimes, and more.
- Reporting: Generates reports that provide insights into the overall performance of your Azure resources.
Cons:
- Sensor-Based Costing: Since PRTG uses sensors for monitoring, the cost scales with the number of sensors you use. This can become expensive if you require extensive monitoring of numerous resources and their various aspects.
- Limited Out-of-the-Box Azure Functionality: While existing sensors can be customized for Azure, PRTG might not have the same level of pre-configured Azure-specific features compared to dedicated Azure monitoring tools.
Since this is a sensor-based system, the cost depends on the number of sensors you use. Typically, you use one sensor to monitor a single aspect of a resource. For example, you need a sensor to monitor the database size of your SQL database and another sensor to know its CPU usage, and so on.
The cost is:
- Up to 500 sensors – $1,750
- 501-1000 sensors – $3,200
- 1001-2500 sensors – $6,500
- 2501-5000 sensors – $11,500
- Unlimited sensors for one installation – $15,500
- Unlimited sensors for unlimited sensors – Custom
You can access a 30-day free trial to work out your network requirements.
6. Datadog Azure Monitoring
Datadog has advanced Azure monitoring capabilities to collect different metrics from your cloud resources and analyze them for advanced insights into the health and performance of your applications.
Key Features:
- Agentless Monitoring: Eliminates the need to install monitoring agents on Azure VMs, simplifying setup and reducing overhead.
- Comprehensive Metrics Collection: Gathers detailed metrics directly from Azure VMs, including device-specific information like location.
- Seamless Azure Integration: Offers effortless integration with your existing Azure environment.
- Automated Scripting: Provides pre-built automated scripts to streamline monitoring tasks and free up IT resources.
- Unified View: Maps your legacy systems alongside your cloud-based Azure environment, offering a unified monitoring experience.
Why Do We Recommend It
Datadog is recommend for its powerful and highly integrated monitoring and analytics capabilities tailored for Azure environments. Datadog provides real-time visibility into the performance and health of your Azure infrastructure and applications through an intuitive, customizable dashboard that aggregates data from across your entire stack.
Who Is It Recommended For?
It is ideal for DevOps and Site Reliability Engineering teams who need deep insights into application performance and system health to maintain high availability and performance. The tool’s scalability and extensive integration capabilities make it suitable for businesses that are growing and evolving rapidly.
Pros:
- DevOps Friendly: Integrates well with DevOps workflows and pipelines, facilitating a cohesive approach to development, operations, and monitoring.
- Effortless Setup and Management: Agentless monitoring and seamless Azure integration simplify setup and ongoing management.
- In-Depth Insights and Analytics: Datadog goes beyond basic monitoring by providing deep dives into your Azure environment’s health and performance, empowering data-driven decision making.
- Automated Scripting and Efficiency: Pre-built scripts streamline tasks and improve monitoring efficiency.
Cons:
- Cost: Datadog is a paid service. Evaluate the pricing structure to ensure it aligns with your budget.
- Learning Curve: While offering a user-friendly interface, the extensive feature set might have a steeper learning curve compared to basic Azure monitoring tools.
Datadog offers three comprehensive plans.
- Free – $0 – Supports up to five hosts and retains metrics for just a day
- Pro – $15/host/month – Supports 600+ integrations and retains metrics for 15 months
- Enterprise – $23/host/month – Provides machine learning-based alerts and advanced controls
Click here for a free trial.
7. Serverless360
Serverless360 offers three Azure monitoring services. These are a logical application creator that groups together and monitors Azure services; a distributed tracing system; and a resource usage tracker. These services are available individually or as a group. The application manager creates an application dependency map that links the newly created logical Azure-based applications with other services and infrastructure, no matter where they are hosted.
The tool provides an application dependency map and distributed tracing that tracks the activities of each business process end-to-end.
Key Features:
- Logical Application Mapping: Allows you to create logical applications that group related Azure services, simplifying monitoring and understanding application dependencies.
- Performance Insights and Alerting: Translates performance data from individual Azure services into actionable insights for your logical applications.
- Automated Remediation: Offers the ability to define automated remediation actions for specific performance issues, reducing manual intervention and downtime.
- End-to-End Tracing: Traces business processes across your logical applications, leveraging distributed tracing to generate detailed activity logs.
Why Do We Recommend It?
Serverless360 offers a unique blend of features tailored to Azure’s serverless components, including Azure Functions, Logic Apps, Service Bus, and Event Grid. Its intuitive interface and powerful monitoring capabilities allow users to gain deep insights into the performance and health of their serverless applications.
Who Is It Recommended For?
It is recommended for organizations heavily utilizing Azure’s serverless services, such as those adopting microservices architecture or aiming for agile development and deployment. Its focus on Azure serverless components makes it a valuable asset for businesses seeking to optimize their serverless applications’ performance and reliability.
Pros:
- Deployment Flexibility: Provides deployment options as a SaaS platform, a virtual appliance, or directly as an Azure service, catering to diverse needs.
- Application-Centric View: Moves beyond basic Azure service monitoring by providing a holistic view of your application performance and dependencies.
- Cost Management: Tracks Azure service utilization and generates reports on your Azure spending. This allows you to identify potential cost-saving opportunities.
- Free Trial and Demo: Offers a free trial of their SaaS platform and a guided demo to help you evaluate the tool before committing.
Cons:
- Limited Transparency on Pricing: Pricing list is not published. You need to request a quote after registering for a demo.
- Steep Learning Curve: The application-centric approach and features like automated remediation may pose a steeper learning curve compared to basic Azure monitoring tools.
Serverless360 doesn’t publish a price list. You can register for the free demo and request a quote.
Click here to get a free trial of the Serverless360 SaaS platform.
8. OpsView
OpsView gives clear visibility into your Azure services so that you can use them well for your business requirements. It consolidates all notifications and metrics in a single place and sends notifications if any values fall below the established threshold levels.
Key Features:
- Simple Setup: A configuration wizard streamlines the setup process, minimizing the time and effort required to get OpsView up and running in your Azure environment.
- Automatic Host Discovery: Easily identifies and monitors all the existing hosts within your Azure environment, ensuring comprehensive coverage.
- Azure-Specific Monitoring: Tracks a wide range of metrics crucial for efficient Azure utilization. It includes dedicated monitoring for Azure Elastic Database features and seven service checks specifically designed for Azure VMs.
- Diverse Monitoring Tools: Offers a comprehensive set of tools to monitor various Azure services, providing a centralized view of your Azure infrastructure health and performance.
- Third-Party Integration: Integrates seamlessly with third-party alerting and integration tools, allowing you to customize notifications and workflows based on your preferences.
Why Do We Recommend It?
OpsView provides extensive monitoring features, such as real-time performance tracking, customizable dashboards, and automated alerts, which help ensure the health and efficiency of your IT operations. Its robust integration capabilities allow seamless data collection from various sources, making it a great tool for monitoring diverse environments.
Who Is It Recommended For?
It is recommended for medium to large enterprises that require a unified monitoring solution capable of handling complex and heterogeneous IT environments. Organizations seeking to improve operational efficiency will find it attractive.
Pros:
- Fast and Easy Setup: The configuration wizard simplifies the setup process, making OpsView a good choice for organizations seeking a quick and easy deployment.
- Extensive Monitoring: Offers a wide range of monitoring capabilities specifically designed for Azure resources, including VMs, Elastic Database features, and various other Azure services.
- Scalable Plans: Offers plans that cater to both small and large organizations based on the number of resources being monitored.
Cons:
- User Interface and Usability: Some users find the user interface to be less intuitive and modern compared to other Azure monitoring solutions.
- Support and Documentation: Official documentation and support can sometimes lack detail, making it challenging for users to resolve issues independently.
OpsView offers two plans, and they are OpsView Cloud and Enterprise. The first plan is ideal for companies that want to monitor 150 to 50,000 hosts, while the second plan is more suited for large enterprises that want to host more than 50,000 resources.
Click here to schedule a demo.
9. ScienceLogic
ScienceLogic’s Azure monitoring tools analyze the performance and well-being of your Azure platform and all the services and applications that run on it. It identifies dependencies and gives you the appropriate insights to boost its performance.
Key Features:
- Infrastructure Monitoring: Detects and diagnoses issues across your entire Azure cloud infrastructure, providing a holistic view of your environment’s health.
- Dependency Mapping: Maps the dependencies between different Azure resources, allowing you to quickly identify the potential impact of an issue in one area on other parts of your infrastructure.
- Advanced Analytics: Segments your Azure monitoring data based on various criteria (geography, technology, business unit) for a more refined and streamlined understanding of performance and potential problems.
- In-Depth Log Monitoring: Provides deep dives into log data, facilitating troubleshooting and root cause analysis of issues within your Azure environment.
- Resource Optimization: Identifies idle resources within Azure, helping you optimize your resource utilization and potentially reduce costs.
- Predictive Analytics: Identifies potential problems before they occur, giving you a proactive approach to maintaining Azure performance and preventing downtime.
Why Do We Recommend It?
ScienceLogic goes beyond basic monitoring by identifying potential problems before they impact users. This proactive approach with features like predictive analytics and in-depth log monitoring helps prevent downtime and streamline troubleshooting.
Who Is It Recommended For?
ScienceLogic is ideal for organizations managing complex Azure environments or those that require deep insights and strategic planning for their Azure investment. The advanced analytics capabilities empower informed decision-making to maximize the value you get from your Azure platform.
Pros:
- Proactive Problem Detection: Goes beyond basic monitoring by identifying potential issues before they impact users, reducing downtime and improving overall system stability.
- Alerting: Sends alerts to notify you of critical issues within your Azure environment, allowing for prompt resolution.
- Strategic Planning: Assists you in strategizing how to get the most value out of your Azure platform by identifying opportunities for optimization and cost savings.
Cons:
- Limited Pricing Information: Readily available information might not disclose pricing details. You might need to contact ScienceLogic for a quote.
- Cost: ScienceLogic can be expensive, especially for small to medium-sized enterprises. Licensing fees and costs associated with scaling the solution can add up quickly.
Contact the sales team for a custom quote. Click here to request a demo.
10. Dynatrace
Dynatrace comprehensively monitors the health of your entire Azure infrastructure and makes appropriate recommendations to improve its efficiency and performance.
Key Features:
- Automated Dependency Mapping: Automatically discovers and maps dependencies between different Azure resources, allowing you to understand the potential impact of issues and streamline troubleshooting.
- Deep Visibility: Provides comprehensive visibility into the health and performance of your Azure environment, including hosts, containers, traces, and logs.
- End-to-End Transaction Tracing: Automatically captures transactions across every tier within your Azure applications, providing a holistic view of performance.
- CI/CD Automation: Automates CI/CD workflows, streamlining development and deployment processes.
- Innovation Acceleration: Shortens innovation cycles by providing faster problem resolution and improved performance insights.
Why Do We Recommend It?
Dynatrace leverages AI to automatically detect problems before they impact users. This proactive approach combined with features like automatic dependency mapping and root cause analysis empowers faster issue resolution and minimizes downtime.
Who Is It Recommended For?
Ideal for organizations managing complex Azure deployments or those seeking to accelerate development cycles and simplify cloud migrations. Organizations with the resources to invest in an AI-powered solution that values automation and deep insights will find it attractive.
Pros:
- Leverages AI: Automatically identifies problems within your Azure environment, minimizing the need for manual configuration and ensuring proactive issue detection.
- Extensive Technology Support: Supports over 500 technologies, offering the broadest multi-cloud and technology coverage for comprehensive monitoring.
- Azure Migration Acceleration: Provides valuable insights and simplifies the process of migrating your applications to the Azure cloud.
- Cloud-Native Support: Offers out-of-the-box support for cloud-native architectures, making it well-suited for modern Azure deployments.
Cons:
- Cost: The pricing model, based on the number of hosts or the amount of data ingested, can quickly become costly as your monitoring needs grow.
- Complexity: The extensive features and AI-driven approach may result in a steeper learning curve compared to basic Azure monitoring tools.
Dynatrace offers six plans, and they are:
- Full-stack monitoring – $69 a month for an 8GB host
- Infrastructure monitoring – $21/month for an 8GB host
- Digital Experience Monitoring – $11/month for 10k digital experience monitoring units
- Application security – $10/month for an 8GB host
- Open ingestion – $25k/month for 100k Davis Data Units
- Cloud Automation – Contact the sales team
Click here for a free trial.
11. AppDynamics
AppDynamics offers advanced Azure monitoring tools that provide observability into the entire Azure landscape. It troubleshoots performance issues and optimizes all the applications that run on it.
Key Features:
- Scalable Application Monitoring: Designed to monitor fast-growing applications at scale, catering to the needs of dynamic Azure environments.
- Deep Visibility: Provides comprehensive visibility into applications built on .NET, .NET Core, Azure services, and serverless functions, offering a holistic view of application performance.
- Automated Discovery: Automatically discovers applications and their dependencies within your Azure environment, saving time and effort on manual configuration.
- Performance Baselines: Establishes performance baselines for your Azure applications, allowing you to identify deviations and potential issues.
- Real-Time Dependency Visualization: Visualizes real-time interactions between all application dependencies, providing valuable insights for troubleshooting and performance optimization.
Why Do We Recommend It?
AppDynamics excels at providing in-depth visibility into application health, including real-time dependency visualization and code-level instrumentation. This allows you to pinpoint performance bottlenecks and proactively address issues before they impact users.
Who Is It Recommended For?
Ideal for organizations managing large or rapidly growing Azure applications, especially those built with .NET technologies. It’s also suitable for organizations with the resources to invest in a performance-centric solution and that value deep application insights and proactive performance management.
Pros:
- Scalability and Performance Focus: Well-suited for organizations managing large or rapidly growing applications on Azure, with a strong focus on performance optimization.
- Deep Visibility and Insights: Provides comprehensive visibility into various aspects of your Azure applications, including dependencies, performance baselines, and real-time interactions.
- Simplified Migration and Serverless Support: Streamlines Azure migration and offers dedicated monitoring features for serverless functions within Azure.
- Automatic Discovery and Code-Level Instrumentation: Automates tasks like application discovery and code instrumentation, reducing manual effort and setup time.
Cons:
- Limited Focus on Core Infrastructure: Has a strong focus on application performance monitoring and might not offer the same level of depth for monitoring core Azure infrastructure health compared to some other tools.
- Steep Learning Curve: The extensive feature set and emphasis on code-level instrumentation may result in a steeper learning curve compared to more basic Azure monitoring tools.
AppDynamics offers four pricing plans, and they are as follows:
- Infrastructure Monitoring Edition – $6 per month per CPU core
- Premium Edition – $60 per month per CPU core
- Enterprise Edition – $90 per month per CPU core
- Accurate User Monitoring – $0.06 per month per 1000 tokens
Click here for a free trial.
12. LogicMonitor
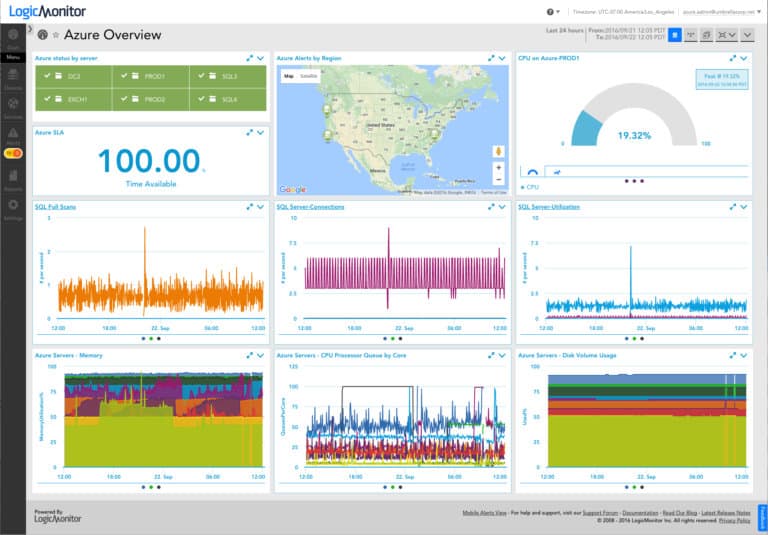
LogicMonitor is a comprehensive tool that can prevent outages and optimize your IT resources for gleaning better value from them. It integrates with 2000 services, including Azure, to gather metrics and analyze them for in-depth analytics.
Key Features:
- Out-of-the-Box Azure Monitoring: Requires little to no additional effort or configurations, allowing for quick deployment and setup.
- Performance Metrics Monitoring: Tracks and monitors performance metrics of Azure-hosted infrastructure, ensuring optimal operation and quick identification of issues.
- Customizable Dashboards: Enables the creation of dashboards to display critical data tailored to your organization’s specific needs.
- User-Friendly Interface: Simplifies cloud monitoring with an intuitive interface and extensive functionality, making it accessible even for users with less technical expertise.
- Deep Visibility: Provides complete visibility into the health and performance of Azure applications through Resource Performance monitoring, Azure monitoring, and ROI monitoring modules.
Why Do We Recommend It?
LogicMonitor goes beyond basic Azure monitoring by providing a unified view that incorporates both your Azure resources and your on-premises infrastructure. It also offers built-in cost monitoring to help you stay on top of your Azure spending
Who Is It Recommended For?
A good choice for SMBs or organizations with limited IT resources that seek a user-friendly and customizable Azure monitoring solution with cost-monitoring capabilities.
Pros:
- Quick and Easy Setup: The out-of-the-box functionality means minimal setup time and effort, allowing teams to start monitoring quickly.
- Compliance Assurance: Ensures adherence to existing monitoring standards, maintaining regulatory compliance and best practices.
- Migration Support: Simplifies and manages migrations, reducing complexity and enhancing predictability, which is crucial for maintaining service continuity.
Cons:
- Resource Intensive: The comprehensive monitoring capabilities may require significant system resources, which could impact performance if not properly managed.
LogicMonitor offers two plans:
- Pro – Up to 199 devices
- Enterprise – 200+ devices
Click here to get a quote for each. Click here to try it for free.
Conclusion
To conclude, Azure monitoring tools come with advanced capabilities to provide all the insights you need about the performance of your Azure environment, using which you can make better decisions, optimize the working, reduce costs, and more.
The tools mentioned above are some of the best in this space, and we hope the detailed explanation of its features was useful in helping you decide the right one for your organization.

