The performance of your web apps has a big bearing on not just your revenue, but also on your brand image and credibility in the digital world. You cannot afford to allow your web app to slow down or even fail when traffic increases and this means, you’ll have to stay on top of its performance all the time.
Though some companies still prefer to take the manual route, a better option is to use automated tools that give you insights about the performance of your web application in real time.
One such tool that displays application performance in real time is New Relic. This tool provides flexible and dynamic monitoring to give you the right insights about the performance of your web app.
Though this app works great in most situations, it tends to be pricey, especially for small and medium businesses. Also, it comes with a steep learning curve that may not be ideal for all users. Some important metrics are not covered as well in this tool.
Due to these reasons, consider looking at some alternatives to New Relic as they can be easy on your budget and at the same time, can give you the information you want.
Some of the popular alternatives to New Relic include some of the following services:
- Datadog APM – FREE TRIAL This application performance monitoring package is our first choice. It is cloud-based and traces connections between APIs and development frameworks right down to the code level. Start a 14-day free trial.
- Site24x7 Website Monitoring – FREE TRIAL A combination of an application performance monitor and website testing tools makes this the perfect New Relic alternative. This is a cloud-based service. Start a 30-day free trial.
- ManageEngine Applications Manager – FREE TRIAL A package of monitoring tools and performance analysis utilities for on-premises and cloud-hosted applications. Installs on Windows Server and Linux. Start a 30-day free trial.
- AppDynamics A cloud-based application monitor that includes app dependency tracing and live performance displays.
- Dynatrace An AI-driven application monitor that is particularly strong at tracking virtual environments. This is a cloud-based service.
- Zenoss A cloud-based service that ties application monitoring through to infrastructure monitoring.
- Raygun A cloud-based DevOps tool for Web applications and internet-based services.
- Stackify Retrace A cloud-based application performance monitor with a focus on website testing and improvement.
The Best New Relic Alternatives
Let’s take a detailed look into each of these tools, some screenshots, and how they stack up against New Relic.
1. Datadog APM – FREE TRIAL
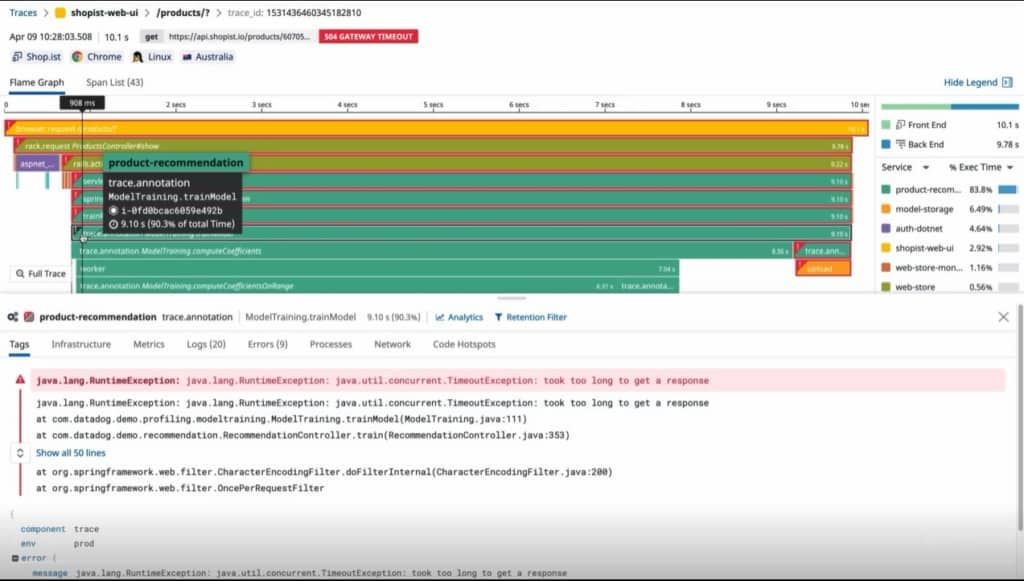
Datadog APM is a cloud-based service that focuses on tracing the connections between those hidden functions that lie behind APIs and development frameworks. Modern Web app development relies on the services of plug-in libraries and environments that provide a great deal of functionality, cutting down development time. While that strategy cuts down on coding time, it makes tracing performance impairment root causes a nightmare. The Datadog APM gets behind those provided functions and identifies the actual code that is probably working elsewhere on someone else’s server.
Key Features
The APM supports the development of Web applications and the management of live Web systems through the following facilities:
- Application dependency mapping to identify all supporting functions
- Detection of the microservices that lie behind APIs
- Distributed tracing to show live application operations
- Code profiling that identifies each line of an application as it runs
- Connect the APM to real-user monitoring for root cause
- Data retention for historical analysis
- Storage space included in the plan
- Facilitates step-by-step code walkthrough
- Regression detection
- Offers comparisons between code versions
- Track latency
- See inside applications written in Java, .NET, PHP, Node.js, Ruby, Python, Go, and C++
Why do we recommend it?
After taking advantage of Datadog APM’s 14-day free trial, we were particularly impressed by its ability to trace the microservices that lie behind APIs. The tool’s application dependency mapping and distributed tracing make it exceptionally powerful for managing complex web systems. It’s flexibility, ease of use, and and powerful performance monitoring secure Datadog APM at the top of our list.
Who is it recommended for?
Datadog APM is ideal for development and operations teams working on web applications that rely heavily on APIs, microservices, and multiple programming languages. Its robust features make it a good fit for organizations that want to perform deep dives into their application performance and troubleshoot effectively.
Datadog APM is available in two editions: APM and APM + Continuous Profiling. Both of these plans are subscription services. The lower plan costs $31 per month per host when paid annually and the rate for the higher plan is $40 per month per host on the yearly payment plan. For more information about Datadog APM, click here. Get a 14-day free trial.
2. Site24x7 Website Monitoring – FREE TRIAL
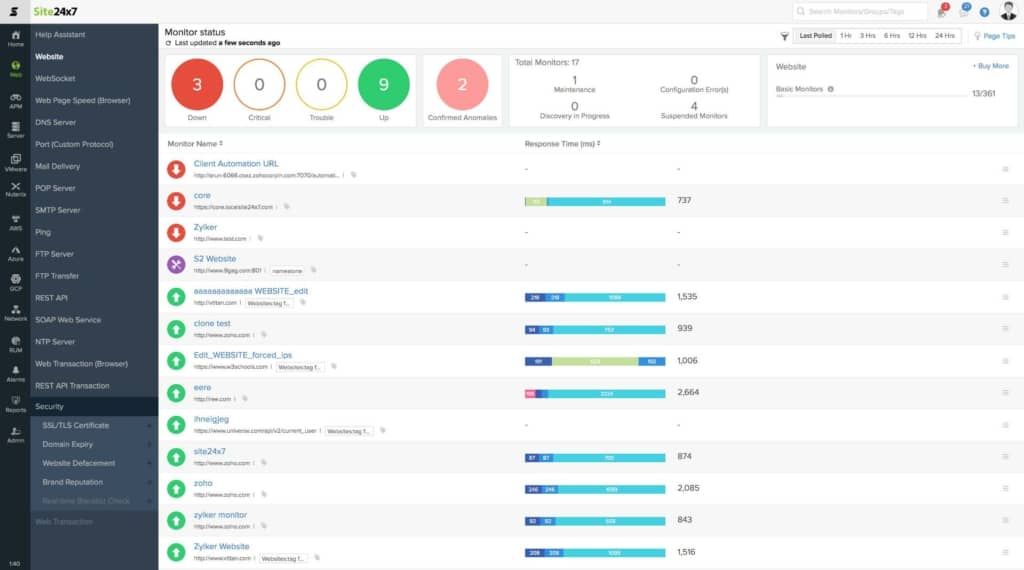
Site24x7 Website Monitoring is a collection of system monitoring and management tools that examines the performance of websites, tracing issues down through applications and services, server resources, network device operations, to bandwidth utilization on a network.
Key Features
Important website monitoring and development features include:
- Uptime monitoring from 110 locations around the globe
- Response time monitors with root cause analysis
- Browser-based synthetic transaction monitoring that links through to an application stack trace
- Website defacement protection
- SSL Certificate monitoring
- Reputation assurance
- Domain expiry alerts
- Server resource monitoring
- Load balancer monitoring
- Security device monitoring
- Traffic management features
- Live performance checks on all infrastructure
- Status alerts that can be forwarded by SMS, email, voice call, or instant messaging post
- Capacity planning tools for servers and networks
- Internet connection monitoring
- Unified monitoring for multiple sites and cloud resources
- Processing and storage are included in with the price of the software
- A cloud-based console accessible from anywhere through any standard Web browser
Why do we recommend it?
We utilized the 30-day free trial of Site24x7 Website Monitoring to assess its capabilities. The tool’s response time monitors with root cause analysis and uptime monitoring from 110 locations globally stood out, offering a robust solution for website performance tracking.
Who is it recommended for?
Site24x7 Website Monitoring is ideal for businesses that require extensive website monitoring features, such as uptime tracking, SSL Certificate monitoring, and capacity planning. It’s especially useful for companies with a global customer base due to its monitoring capabilities from various locations worldwide.
Site24x7 Website Monitoring is available in four editions – the Starter at $9 per month, the Pro at $35 per month, Classic at $89 per month, and Enterprise from $225 per month. These are based on annual subscription prices. Get a 30-day free trial. For more information click here.
3. ManageEngine Applications Manager – FREE TRIAL
ManageEngine Applications Manager is a good alternative to New Relic because it has extensive processes for monitoring and managing applications for websites and mobile apps. Unlike New Relic, the Applications Manager is a package that needs to be installed on-premises. It is available for Windows Server and Linux.
Key Features
Some of the important features of Applications Manager are:
- Monitors user-facing software, supporting applications and services, and also the servers that host them
- Monitors on-premises and cloud-based systems
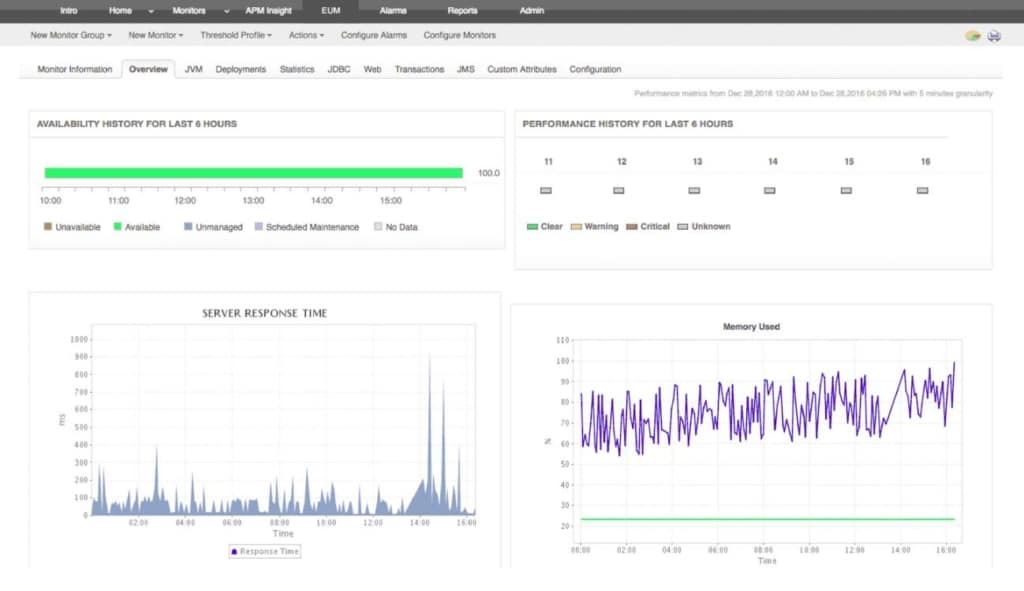
- Has extensive routines for monitoring website performance
- Includes synthetic monitoring and browser-based response time tests
- Can analyze the code for web applications and trace SQL query performance in supporting databases
- Is able to monitor API performance and trace the execution of microservices
- Uses machine learning techniques to establish performance baselines
- Includes an alerting mechanism to highlight system problems
- Includes root cause analysis tools
- Features a capacity planning and demand trending utility
- Includes a performance reporting module
Why do we recommend it?
After downloading and installing ManageEngine Applications Manager on our on-premises servers, we were impressed by its extensive routines for monitoring website performance and its machine-learning techniques for establishing performance baselines.
Who is it recommended for?
ManageEngine Applications Manager is suitable for businesses that need on-premises solutions for monitoring both cloud-based and physical systems. The tool is particularly useful for organizations that need deep insights into web application code and SQL query performance.
Applications Manager is available in a Free edition that is limited to monitoring five application statuses. The Professional edition can monitor up to 500 Applications for $945 per year. The Enterprise edition can monitor up to 10,000 application statuses at a price of $9,595. Download a 30-day free trial.
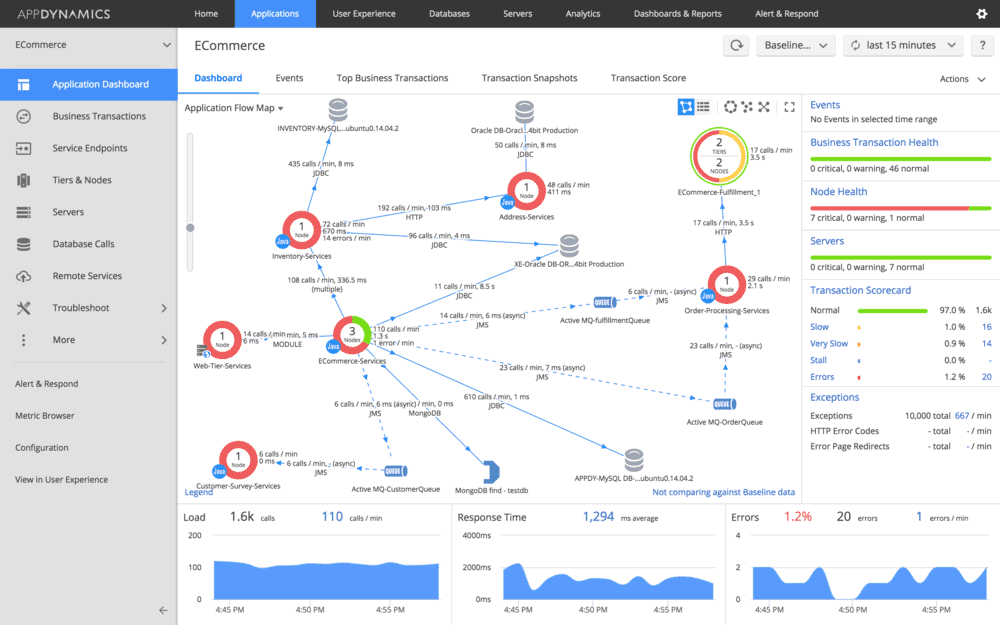
4. AppDynamics
AppDynamics is an application performance monitoring tool from Cisco that continuously monitors your application and gives you the necessary business intelligence to act on it. This tool is most ideal for organizations that have a large and complex network comprising of many websites and applications.
Key Features
Some of the salient features of AppDynamics are:
- Gives complete visibility into your network so you can identify the root cause and fix it at the earliest
- Correlates the data flow across multiple events and applications to give a consolidated set of insights in real-time
- Allows you to create custom thresholds and metrics
- Provides code level visibility
- Works as an on-premise or SaaS application
- Enables you to monitor different sensors, smart devices, and IoT applications
- Offers multiple search options
- Monitors multiple platforms, depending on the needs of your business
- Troubleshoots performance issues in a production environment
- Handles dynamic baselining and alerting
Why do we recommend it?
We set up AppDynamics in a test environment and were notably impressed by its ability to correlate data flow across multiple events and applications. The custom threshold settings and code-level visibility make it a strong contender in application performance monitoring.
Who is it recommended for?
AppDynamics is best for larger organizations with complex networks comprising many websites and applications. It’s a good fit for businesses that require real-time insights and the ability to create custom thresholds and metrics for nuanced performance monitoring.
AppDynamics comes in three versions – APM Pro, APM Advanced, and APM Peak. APM Pro comes with a basic set of features that includes basic infrastructure monitoring while APM Advanced includes the features of APM Pro along with server and network visibility. APM Peak, on the other hand, includes everything in APM Advanced and also includes business performance monitoring, transaction analysis, and more. Contact the sales team for custom pricing. Download a free trial here.
5. Dynatrace
Dynatrace is an application monitoring software based on the AI platform. It is best suited to gain software intelligence for the enterprise cloud.
Key Features
The important features of Dynatrace are as follows.
- Gives complete visibility into public, private, and hybrid cloud environments
- Provides full-stack discovery and performance management
- Everything is automated, so it requires no manual intervention whatsoever. Even comes with zero-touch configuration, so set up and ease is a breeze for all users
- Visualizes application dependencies and infrastructure
- Continuously discovers and maps devices as they are added or removed from a network
- Identifies the root cause of problems at the earliest
- Understands the inter-dependencies within your business using AI
- Gives precise insights that have a bearing on your business operations and profitability
Why do we recommend it?
We tested Dynatrace by installing its free trial and navigating its AI-powered interface. The tool excelled in providing automated full-stack discovery and performance management, requiring zero manual intervention and making the setup incredibly easy.
Who is it recommended for?
Dynatrace is ideal for enterprise-level organizations looking for a hands-off, automated solution for monitoring public, private, and hybrid cloud environments. Its AI capabilities make it especially suitable for businesses that require not just monitoring, but also predictive insights into system performance and inter-dependencies.
Contact the sales department for a custom quote. Download your free trial here.
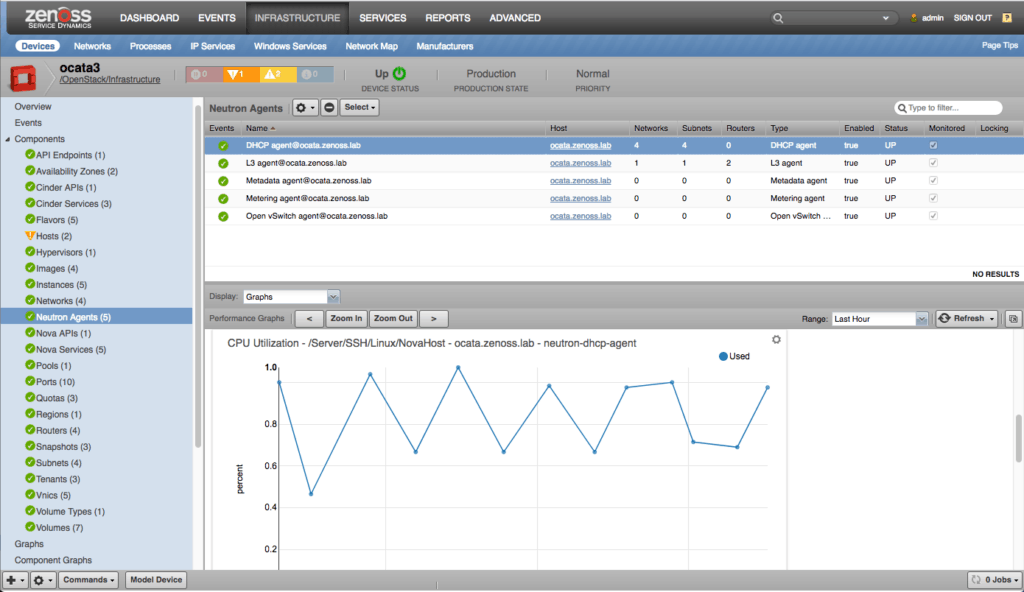
6. Zenoss
Zenoss is a performance management tool that helps to identify and fix issues at the earliest in hybrid IT environments. This SaaS-based intelligent IT platform gathers data, analyzes the same, and presents it in the form of actionable business intelligence.
Key Features
The main features of Zenoss are:
- Dynamic dashboards give you a bird’s eye view of your application’s performance and also makes it easy to share or collaborate with others
- You can use events to drive automated monitoring policies, thereby bringing down the cost of your monitoring capabilities
- Data gathered from applications is stored on HBase and OpenTSDB for future analysis
- The load is dynamically balanced across the entire pool of resources
- Requires little to no manual intervention
- Makes it easy to apply and roll-back any configuration change
- Continuously monitors your critical applications to ensure that you stay on top of the performance of your applications at all times
- Comes with built-in backup and restore procedures
Why do we recommend it?
After downloading and setting up Zenoss, we were impressed by its dynamic dashboards and the ease with which we could automate monitoring policies. Its SaaS-based intelligent platform efficiently gathered and analyzed data, requiring minimal manual input from our end.
Who is it recommended for?
Zenoss is well-suited for organizations operating in hybrid IT environments who are seeking a platform that not only monitors but also analyzes data for actionable insights. If you’re looking for a tool that can dynamically balance loads and offer built-in backup and restore features, Zenoss is worth considering.
Contact Zenoss for a custom quote. Download your free trial here.
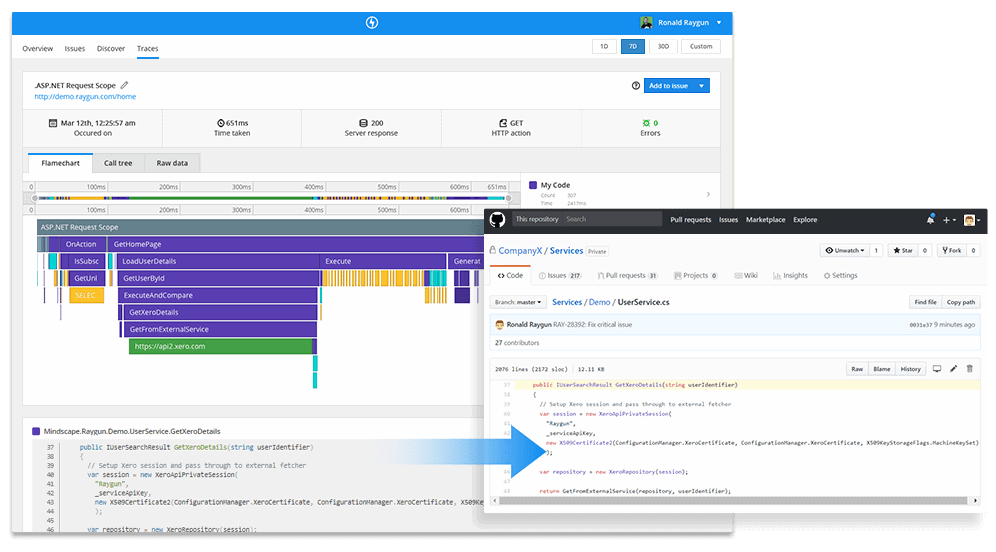
7. Raygun
Raygun is a monitoring tool that offers wide-ranging support to help you build faster and disaster-resilient web applications. It specializes in identifying and diagnosing problems from deep within complex environments.
Key Features
The features of Raygun are:
- Comes with advanced user tracking features that establish the connection between errors and their cause
- Gives insights about each session’s data to give you a detailed idea of the performance of your app
- Identifies problematic deployments at the earliest
- Allows you to set thresholds for logging and reporting errors
- Attaches a trail of events together to take you to the root cause of a problem
- Dashboards give a quick look into the state of your applications at any point in time
- Automatically finds and fixes errors, depending on your configuration
- Combines server-side timing with errors to give you a holistic view of a problem
Why do we recommend it?
We took advantage of Raygun’s 14-day free trial to test its features, and it didn’t disappoint. The tool provided invaluable insights about session data and was particularly effective in identifying problematic deployments quickly. It also allowed us to set thresholds for error logging and reporting.
Who is it recommended for?
Raygun is an excellent choice for organizations of all sizes looking to build faster and more resilient web applications. With pricing tiers tailored to startups, small businesses, and large enterprises, Raygun offers advanced user tracking and automatic error resolution, making it ideal for those who want detailed performance analytics and quicker problem diagnosis.
The price of Raygun depends on the size of your organization. For startups, it is $79 a month, for small businesses, it costs $199 a month, and for large businesses, Raygun costs $649 a month. Download a 14-day free trial here.
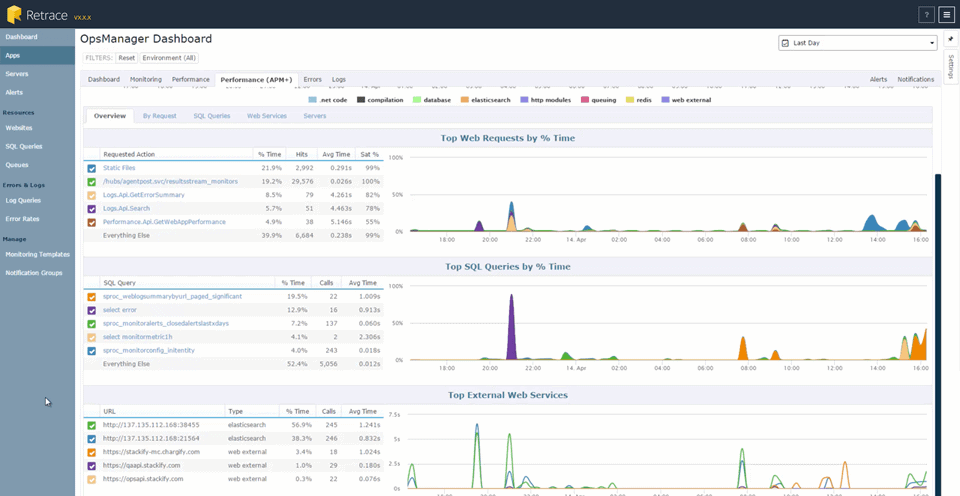
8. Stackify Retrace
Stackify Retrace is a tool that helps to improve your application quality and performance during every stage of the development process. This SaaS-based APM solution monitors cloud-based applications and troubleshoots the same.
Key Features
Here is a look at some of the important features of Stackify retrace.
- It is ideal for developers as it combines application logging with code profiling
- Combines several tools into one, so this alone is enough to monitor the different aspects of your application
- Identifies the bottlenecks in your application’s performance and helps to fix them right away
- Gives you the choice to dynamically change the infrastructure of applications
- Helps to identify performance issues immediately after deployment to a production environment
- Comes with a ton of application and server metrics
Why do we recommend it?
During our testing phase, we found that Stackify Retrace really shines in the development stage. Its unique combination of application logging with code profiling allowed us to pinpoint bottlenecks in real-time. We also appreciated its comprehensive set of metrics, which added depth to our understanding of application and server performance.
Who is it recommended for?
Stackify Retrace is an excellent tool for development teams who are seeking an all-in-one APM solution. It’s particularly useful for cloud-based applications and those in the process of migrating their infrastructures dynamically. If you need a tool that immediately identifies performance issues post-deployment, this SaaS-based solution is well worth the investment.
Stackify retrace costs $50 per month per server. You can download a free trial version here.
Conclusion
To conclude, a reliable application performance tool is necessary to help you stay on top of a wide range of applications that run within your deep and complex networks. While New Relic is a good choice, it comes at a high price and is not ideal for all users.
The above options are good alternatives to New Relic, as they give you the flexibility to customize the performance monitoring aspect and help to fit within your budget.

