Generally speaking, one can break down the life-cycle of a Network into three parts:
- Design
- Implementation/Configuration
- Support/Maintenance
Network Monitoring falls under the 3rd part of this life-cycle. It allows you to keep an eye on the devices in your network (routers, switches, servers, applications, etc.) so that you can take appropriate actions in the event that it becomes necessary. It also allows for proactive management rather than reacting after the fact.

What we will be doing in this article is to compare these two network monitoring solutions and attempt to provide a verdict of which one is best. To do this, we will be comparing both solutions on the basis of the following:
- Cost
- Installation/Setup
- Configuration/Management
- Web Interface
- Host/Service Monitoring
- Monitoring Templates
- Graphs
- Community
- Plugins
Summary of the comparison between Zabbix vs Nagios
| Nagios Core | Zabbix | |
| Cost | Free; Enterprise edition available | Free |
| Installation/Setup | Approx 30 minutes* | Approx 30 minutes* |
| Configuration/Management | Text files
Steep learning curve No graphs No templates |
Web interface
Easier to configure Provides graphs Monitoring Templates available |
| Community** | Large | Medium |
| Plugins | Thousands | Few*** |
* Installation on test server (DigitalOcean). See below.
** Based on research. See below.
*** Zabbix plugins are not available in one location therefore number is difficult to estimate.
We will now look at a more detailed comparison, including Cost, Setup/Installation, Configuration and Mangement and many other important requirements that are needed in a Network monitoring software package.
Zabbix
Why do we recommend it?
Zabbix stands out for its user-friendly web interface and the out-of-the-box availability of graphs, simplifying the monitoring process. Unlike Nagios Core, it does not require text-file configuration, making it more accessible for users unfamiliar with this approach.
Who is it recommended for?
Zabbix is suitable for organizations of all sizes looking for a comprehensive monitoring solution that is easier to set up and manage compared to text-file based alternatives like Nagios Core. Its Auto-Discovery feature makes it particularly useful for larger networks, and its strong community support offers an added layer of reliability and troubleshooting help.
Nagios Core
Why do we recommend it?
Nagios Core offers a high level of customization through text-file configurations, allowing you to tailor the monitoring experience to your specific needs. Despite the steeper learning curve, this provides seasoned administrators with a powerful tool for in-depth monitoring.
Who is it recommended for?
Nagios Core is best suited for experienced IT administrators and organizations that require a highly customizable monitoring solution. Its text-file based configuration provides the flexibility needed for complex network environments, although it might be intimidating for users new to this type of setup.
Cost
Not only are Zabbix and Nagios open source, they are also free (open source does not always mean free). However, there are slight differences between these two solutions. Zabbix is completely free/open-source and does not have a separate Enterprise edition. Nagios on the other hand comes in two flavors: Nagios Core (free and open source) and Nagios XI (Enterprise edition).
Note: This article discusses Nagios Core and not Nagios XI. Nagios XI has more features and add-ons than Nagios Core and some of the comments in this article will not apply to Nagios XI.
It is important to point out that even though Zabbix does not have a separate Enterprise edition, the company behind it offers several paid support services to customers who require these services. For example, there are five (5) tiers of technical support to choose from. They can also help you integrate the monitoring solution if you want.
Installation/Setup
To prepare for this article, I installed Zabbix and Nagios on virtual machines in the cloud (DigitalOcean). You can refer to this link for how to install Zabbix on DigitalOcean and this link for the installation of Nagios.
I used a basic setup for my installation: one server as the network monitoring server and one client to be monitored. To be honest, the instructions contained in those links were very easy to follow (mostly copy and paste), coupled with the fact that I have some Linux experience, installing both solutions took approximately 30 minutes each.
If I was to give a tie breaker, I will say the installation for Nagios was a bit more complicated than that for Zabbix.
Configuration/Management
One of the major challenges new users have with Nagios is the fact that you have to do all the configuration in text files, from the main configuration file to the configuration required to define the hosts and services to be monitored. Figuring out how to write these files can take some time, but once you get a hang of it, you can unlock the immense power contained in Nagios.
On the other hand, Zabbix is mostly managed through its web interface which means that the learning curve is not so steep.
Web Interface
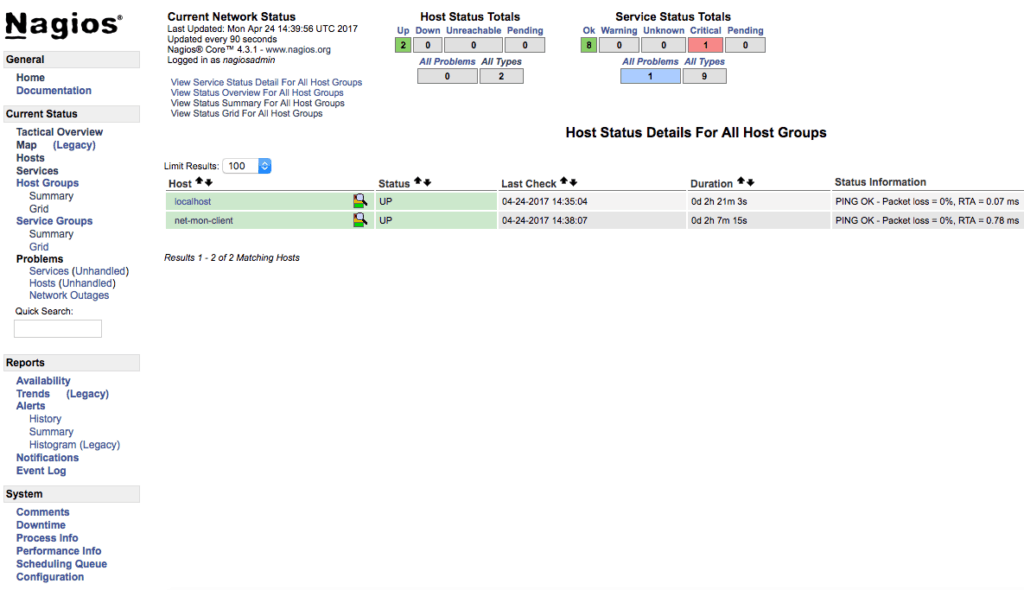
Even though Nagios is configured using text files, it also comes with a web interface. However, the Nagios web interface is very rudimentary, looks outdated and is basically view-only.
I use the term “view-only” because viewing monitored hosts/services and generating reports is really all you can do on the Nagios web interface – it doesn’t allow you to configure anything.
Note: As with almost everything in Nagios, you have other plugins (web frontends) that can be used to administer Nagios.
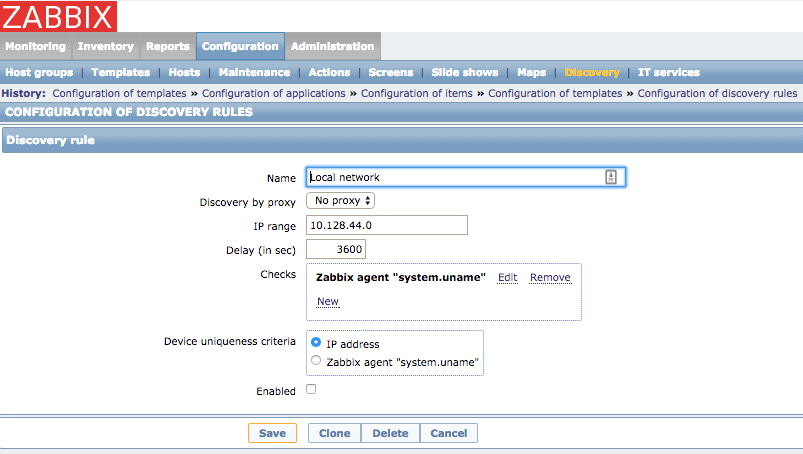
The web interface of Zabbix is definitely better looking than that of Nagios, even though it could also use some work. The Zabbix web interface has neatly arranged tabs and sub-tabs that let you navigate the different parts of the application. Apart from this, the Zabbix web interface allows you to configure the application, like we already mentioned above.
Host/Service Monitoring
Both Nagios and Zabbix provide agent and agentless monitoring; however, for this article, we tested monitoring with agents installed on the monitored client.
Hint: Agent monitoring means that an agent needs to be installed on the host/device to be monitored.
After installing the Nagios monitoring agent (Nagios Remote Plugin Executor, NRPE) on the client to be monitored, I needed to create a text-based configuration file for that client on the monitoring server before I could start monitoring the client.
On Zabbix, it was easier to add the client to be monitored as this is configured using the web interface. Zabbix also allows you to perform Auto-Discovery of hosts which can be very useful in large networks.
Monitoring Templates
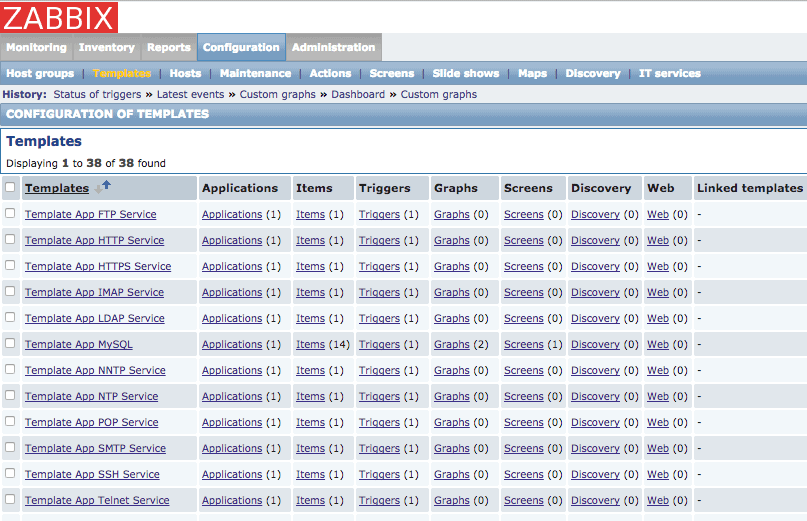
One of the great things about Zabbix is that it already includes templates which you can use to monitor different services. This makes setup faster and easier. The screenshot below shows some of those templates including FTP, HTTP and MySQL.
Nagios on the other hand does not provide such templates. This may not necessarily be a problem because of the huge community and history of Nagios – you are likely to find what you need with a quick online search.
The image below is a snapshot of the service definition for monitoring PING on Nagios:
Graphs
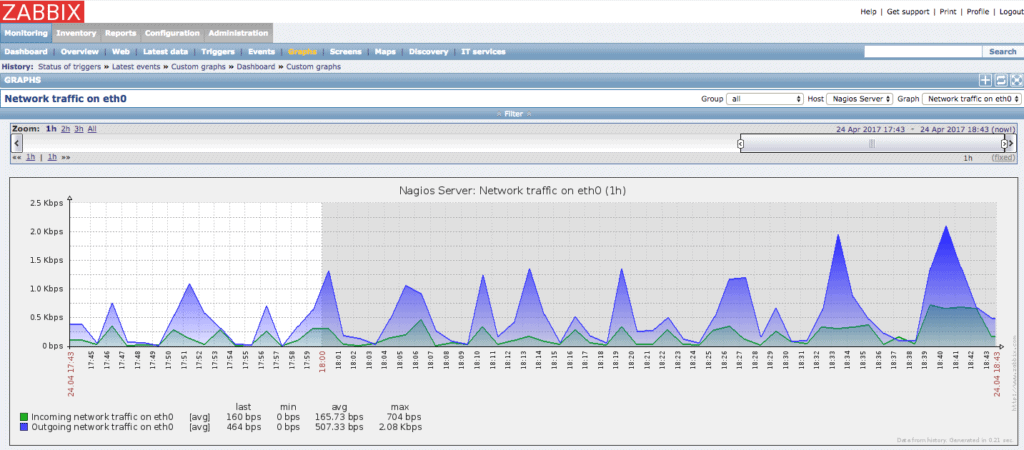
One distinctive difference between Nagios and Zabbix is the out-of-box availability of graphs in Zabbix but the lack thereof in Nagios. As you can imagine, graphs are a very useful way to view data because they can show historical information in an easy to view manner.
Note: There is a graph plugin available for Nagios but it doesn’t come installed by default.
Here is a sample graph from Zabbix showing the Network traffic and Bandwidth usage monitoring on the interface of a server:
Community
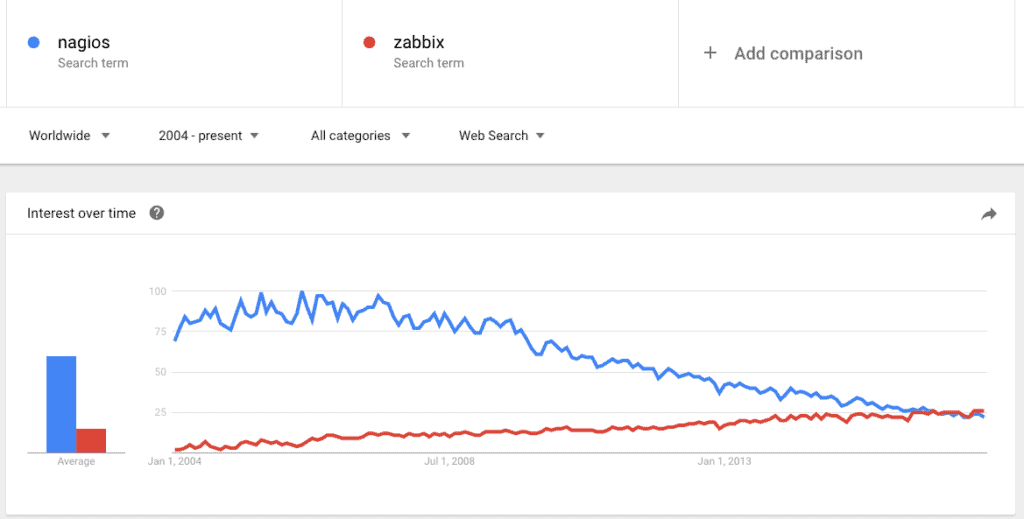
This is one area where Nagios used to have the upper hand over Zabbix. Probably due to the fact that Nagios has been around longer than Zabbix, it used to have a larger and more vibrant community than that of Zabbix. It also seems that Nagios has a larger user install base than Zabbix.
However, based on my recent visit (April 24, 2017) to their respective forums, I found that not only does the Zabbix forum have more registered users, it had more users online at the time I checked.

And in comparison, here’s a Screenshot of the Zabbix forum Users and Active Members:

This alone is not a good indication of the community size of each solution (community is beyond forums); however, the fact remains that interest for Nagios seems to have reduced over the years while that of Zabbix is on the rise.
Plugins
There are a lot more plugins available for Nagios when compared with Zabbix. Some of these plugins are needed to do the things that Zabbix already does out of the box (e.g. graphs). However, the fact remains that that many plugins make Nagios highly customizable.
Verdict
The truth is that depending on what you want to achieve, the size of your network, your skill level and how much effort you are willing to put into your network monitoring, neither of these solutions may be ideal for you. For example, PRTG Network Monitor is easy to use, free to monitor up to 100 sensors, offers graphs, good web interface and lots more! SolarWinds also has very good tools for network monitoring and bandwidth analysis as well (you can see our Full Review on SolarWinds NPM here) as well as our nagios vs solarwinds comparison.
However, if I had to choose between Nagios and Zabbix, I will probably go for Zabbix for two major reasons. Firstly, out of the box, Zabbix is easier to implement because it can be managed via the web interface, comes with nice templates to get started with and provides graphs!
Secondly, since Zabbix does not have a separate Enterprise edition, it means the same features available to free users is also available to commercial users (we are all free users actually!). This is unlike Nagios which offers the (probably) better Nagios XI at a cost.
On the other hand, if you are looking for a fully customizable solution and you are willing to take the time to learn (or already know how to use) Nagios, then you can go for Nagios. Nagios can be really powerful when you get past the steep learning curve. Furthermore, if you neither of these software packages meet your needs, check out some of these Nagios Alternatives for other packages that may suit your needs!
Related Post: Best Zabbix Alternatives

